
How to Measure Training Effectiveness
To really know if your training is working, you need a system. Not just a gut feeling or a stack of happy-face feedback forms. I’m talking about a system that tracks learner engagement, knowledge retention, actual behavioral changes, and the final, all-important impact on business results.
This process is about drawing a straight line from learning activities directly to performance improvements.
Why Bother Measuring Training Effectiveness At All?
Let’s be honest, a lot of corporate training feels like checking a box. We send our teams to a session, they come back with a binder they’ll never open again, and we just cross our fingers and hope for the best. I’ve been there.
But what if you could actually know if the training is working? What if you could prove it?
This guide cuts through the noise to show you why measuring training effectiveness is a strategic necessity. It’s about making smarter, more confident investments in your people.

We’ll move beyond simple ‘smile sheets’ and completion rates to understand the real impact on your team’s skills, on-the-job behavior, and your company’s bottom line.
Connecting Training to Business Goals
The number one reason to measure training is to make sure it supports actual business goals. You’re not just training for the sake of training. You’re trying to solve a specific problem or create a new opportunity, whether that’s increasing sales, reducing safety incidents, or boosting customer satisfaction scores.
Measurement helps you answer the questions that really matter:
- Did the training actually improve the skills it was supposed to?
- Are employees using what they learned back at their desks?
- Is the business seeing a tangible benefit from our investment?
Without the answers, you’re just spending money and hoping for the best.
A key part of this is identifying what needs improvement before you even build a program. Using a structured approach like a training needs assessment template can help you pinpoint specific gaps and set crystal-clear goals right from the start.
Proving the Value of Your Programs
L&D leaders are under more pressure than ever to justify training budgets with hard numbers. The good news? The data is on your side.
Globally, companies that implement robust ROI measurement have reported average returns between 150% and 200% on effective training programs. Think about that. For every dollar spent, they’re seeing $1.50 to $2.00 back in the form of increased productivity, reduced errors, or higher sales.
When you can calculate the ROI of your training initiatives, you can walk into any budget meeting with clear, data-backed evidence. This is how you transform your training department from a cost center into a proven value driver for the entire organization.
And when you can show leadership that your programs are delivering real financial benefits, securing the budget and support you need for future projects becomes a whole lot easier.
Setting Clear Goals for Your Training Program
Before you can measure anything, you have to know what success actually looks like. It’s so easy to get caught up in the idea of training without first defining exactly what we want it to accomplish. I’ve seen it happen countless times. A program gets launched with a vague objective like “improve communication skills,” and then everyone wonders why it’s impossible to prove its value later.
The key is to move away from these fuzzy goals and get super specific about the outcomes you can actually track. This is about building a clear roadmap for success that everyone can understand and get behind.

From Fuzzy Ideas to Concrete Outcomes
Let’s get practical. A fuzzy goal is “improve sales skills.” It sounds good, but what does it really mean? How would you ever know if you achieved it?
A concrete goal, on the other hand, is something you can point to on a chart. Instead of “improve sales skills,” a much better goal would be, “Increase the average deal size by 10% for the enterprise sales team by the end of Q3.” See the difference? It’s specific, measurable, time-bound, and tied directly to a real business result.
Here’s a quick breakdown of how to reframe common training goals:
Fuzzy: Improve leadership skills.
Concrete: Reduce team turnover by 15% within the next 12 months for managers who complete the leadership program.
Fuzzy: Get better at customer service.
Concrete: Improve our average Customer Satisfaction (CSAT) score from 85% to 92% within six months post-training.
This shift in thinking is fundamental. Before you dive into specific evaluation models, it’s worth taking a step back to understand the art and science of measuring what matters in the workplace. It helps ensure your goals are aligned with outcomes that truly move the needle.
Involve Your Stakeholders Early and Often
One of the biggest mistakes I see is creating training goals in a vacuum. The L&D team cooks up a program, then tries to sell it to department heads who may or may not see the need for it. The best way to get buy-in and create meaningful goals is to involve key stakeholders from the very beginning.
This means sitting down with department managers, team leads, and even some of the end-learners themselves. Ask them pointed questions about their biggest headaches and challenges.
Questions to Ask Your Stakeholders:
- What is the biggest operational bottleneck your team is facing right now?
- If you could wave a magic wand, what one skill would make the biggest difference to your team’s performance?
- What business metric are you most focused on improving this quarter?
- Where are the most common errors or complaints coming from?
By asking these questions, you connect your training directly to real business pain points. This alignment makes it so much easier to define success and, later, to measure training effectiveness in a way that actually resonates with leadership.
Use a Framework for Clear Objectives
To make your goals even more powerful, you need a good structure. Many people lean on the SMART framework (Specific, Measurable, Achievable, Relevant, Time-bound), which is a fantastic starting point. Another helpful approach is to frame your goals as clear learning objectives.
A learning objective states what the learner will be able to do after the training. This moves you from passive knowledge to active application. For instance, instead of saying learners will “understand the new software,” a much better objective is, “Learners will be able to process a customer return using the new software in under three minutes without assistance.”
This focus on actionable outcomes is a core concept in instructional design. If you want to go deeper, learning about Bloom’s Taxonomy and its role in creating learning objectives can be incredibly helpful. It provides a structure for thinking about different levels of learning, from basic recall to complex problem-solving.
When your goals are this clear, measuring them becomes a natural next step instead of a dreaded afterthought.
You’ve set clear, specific goals for your training program. Now comes the real question. How do you actually know if it’s working?
There are a ton of frameworks out there, but one has stood the test of time for a reason. Let’s talk about the Kirkpatrick Model.
Even though it was developed way back in the 1950s, the Kirkpatrick Model is still the gold standard for measuring training effectiveness. It’s not complicated. In fact, its beauty lies in its simplicity. It breaks down the evaluation process into four logical levels that take you from a trainee’s initial gut reaction all the way to the final business impact.
It’s so foundational that over 90% of training professionals still reference it in their work. And for good reason. Companies that get it right tend to spend 15-25% less on inefficient training and see up to a 30% jump in key employee performance metrics. You can dig deeper into these findings on the AIHR website.
The real trick, as we’ll see, is making sure you don’t stop measuring after the first or second one.
Let’s break down each level and how to apply it.
The Kirkpatrick Model Levels at a Glance
This table gives you a quick overview of each level, what it measures, and some common ways to gather that information.
| Level | What It Measures | Common Methods |
|---|---|---|
| Level 1: Reaction | How participants felt about the training, their satisfaction and engagement. | “Smile sheets,” post-training surveys, informal feedback sessions. |
| Level 2: Learning | The increase in knowledge, skills, and new attitudes. Did they learn it? | Pre- and post-training assessments, quizzes, skill demonstrations, role-playing. |
| Level 3: Behavior | If participants are applying what they learned back on the job. Did their behavior change? | Manager observations, 360-degree feedback, performance data analysis, self-assessments. |
| Level 4: Results | The tangible impact of the training on business outcomes and the bottom line. | Sales figures, customer satisfaction scores, production numbers, employee retention rates. |
Seeing the whole model laid out like this makes it clear how each level builds on the last, telling a complete story of your training program’s impact.
Level 1: Reaction
The first level is all about gauging how your team felt about the training. Did they like it? Did they find the content relevant and the instructor engaging? This is typically measured with “smile sheets” or quick feedback surveys right after the session wraps up.
Some people dismiss this level as superficial, but I think that’s a huge mistake.
If your team is bored, disengaged, or doesn’t see the point of a program, they’re not going to learn much. They certainly won’t apply it later. Think of it as the foundation of a house. You can’t build anything solid on shaky ground.
Here are a few practical questions you can ask to measure their immediate reaction:
- On a scale of 1-10, how satisfied were you with this training?
- Was the content relevant to your day-to-day work? (Yes/No)
- Did the instructor present the material clearly and effectively?
- What was the single most useful thing you learned today? (Open-ended)
This feedback gives you an immediate pulse check on the learning experience itself.
Level 2: Learning
This is where we move beyond feelings and into facts. Level 2 measures what your participants actually learned. Did they pick up the new skills, knowledge, or attitudes you were aiming for? This is where you find out if the information actually stuck.
To do this right, you need a baseline. That’s why pre- and post-training assessments are so powerful.
If you test employees on their knowledge before the training and then again after, you get a crystal-clear picture of the knowledge lift your program created.
Common ways to measure learning:
- Tests and Quizzes: The most direct way to check for knowledge retention.
- Role-Playing Scenarios: For soft skills like sales or customer service, have them act out a real-world situation. It’s one thing to know a script, it’s another to deliver it under pressure.
- Work Sample Reviews: Ask them to complete a task using the new skill, like writing a piece of code, designing a graphic, or building a project plan.
Comparing the “before” and “after” scores gives you hard data on knowledge gain.
This simple flow chart shows how you can turn this initial feedback into a cycle of continuous improvement.
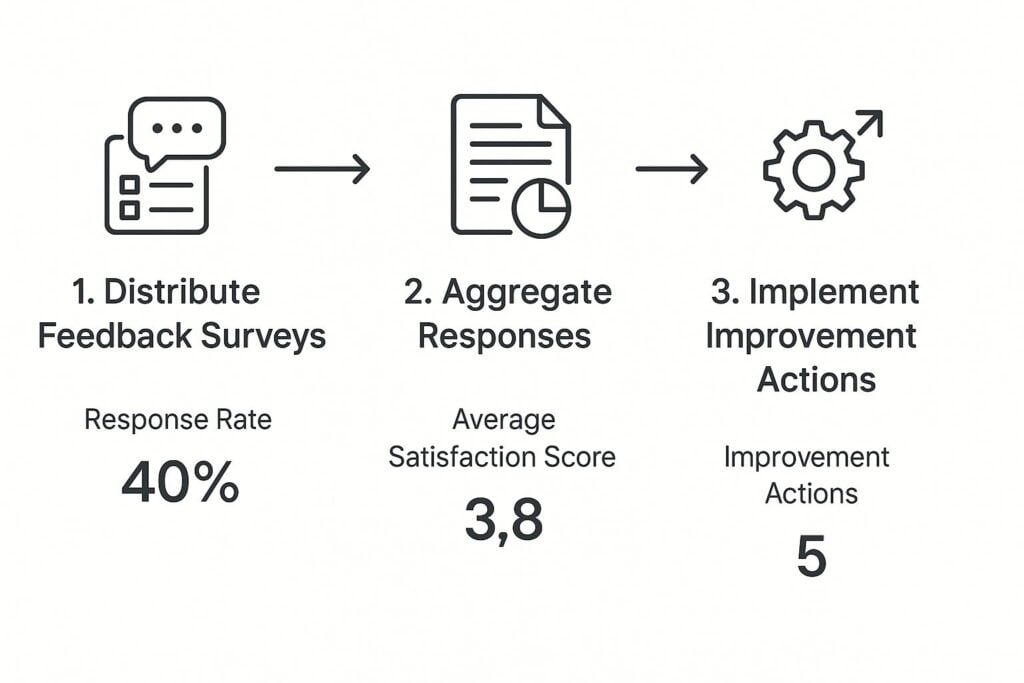
As the visual shows, it’s a loop. You distribute surveys, pull the responses together, analyze the patterns, and then implement changes to make the next session even better.
Level 3: Behavior
Here’s where things get really interesting, and unfortunately, where many organizations drop the ball. Level 3 is all about behavior. Are your employees actually using what they learned back on the job?
This is the critical bridge between learning something and getting results from it. A sales rep can ace a quiz on a new sales methodology (Level 2). But if they never use that technique on a call with a real prospect, the training was a waste of time.
The biggest mistake you can make is assuming that because someone learned something, they will automatically apply it. Measuring behavior is your reality check.
How do you track this? It takes a bit more effort, but it’s absolutely worth it.
- Manager Observations: This is one of the best methods. Give managers a simple checklist to use during one-on-ones to see if their team members are applying the new skills.
- Self-Assessments: Ask employees to reflect on how often they’re using the new skills and what’s getting in their way.
- Peer Feedback: In a collaborative setting, 360-degree feedback from colleagues can offer powerful insights into who is (and isn’t) changing their approach.
- Performance Data: Look at operational metrics. For a software training, you could check usage data to see if people are actually clicking on and using the new features you showed them.
Level 4: Results
Finally, we get to the holy grail of training measurement: Level 4, Results. This is where you measure the tangible impact of the training on the business itself. Did the program help you achieve the concrete outcomes you defined way back in the goal-setting stage?
This is how you connect your training budget directly to the company’s bottom line. The results you track here should be the exact same metrics you identified as goals in the first place.
Examples of Level 4 metrics include:
- An increase in sales revenue or a shorter sales cycle
- A drop in customer support tickets or faster resolution times
- Better quality metrics, like fewer product defects
- A decrease in workplace safety incidents
- Higher employee retention or engagement scores
Measuring at this level can be tricky, since other factors can influence these numbers. But when you combine strong data from all four levels, you can build a compelling story that shows your training program was a key driver of that success. It connects the dots from the first smile sheet all the way to the P&L.
How to Gather and Analyze Training Data

Alright, you’ve got a solid framework in place and you know exactly what you want to measure. Now for the part that can feel a bit intimidating: gathering all the data and actually making sense of it.
But here’s the thing, you don’t need a PhD in statistics to get this right. The real goal is to turn a pile of numbers and comments into a clear, compelling story about your training’s impact.
The secret? Mix your data sources. Think of yourself as a detective on a case. You need both the hard evidence (the numbers) and the witness statements (the feedback) to piece together the full picture.
This means you’ll want to combine your quantitative data, like survey scores and quiz results, with qualitative data, such as open-ended feedback and focus group discussions. One without the other only gives you half the story.
Combining Quantitative and Qualitative Data
Let’s start with the numbers. Quantitative data is anything you can count. It’s objective, straightforward, and gives you a fantastic high-level view of what’s happening.
This includes things like:
- Survey Scores: Rating an instructor on a scale of 1-5.
- Assessment Results: The percentage of people who passed the final quiz.
- Completion Rates: The number of employees who actually finished the course.
- Business KPIs: A 10% reduction in customer support calls after the training.
This kind of data is amazing for spotting broad trends quickly. But it can’t tell you why those trends are happening. That’s where qualitative data comes in. This is the descriptive, anecdotal feedback that adds color and context to your numbers.
For example, your quantitative data might show that only 40% of participants passed the final assessment. That’s a worrying number, but it doesn’t explain the problem. Is the content too difficult? Is the instructor unclear? Qualitative feedback from a focus group might reveal the real issue: learners felt the quiz questions were tricky and didn’t reflect the core material.
See how they work together? The numbers tell you what happened, and the stories tell you why.
Practical Data Collection Methods
You don’t need fancy, expensive tools to start collecting good data. In my experience, simple and consistent methods are often the most effective. I’ve found that a blend of a few key techniques gives the most well-rounded view.
Here are a few methods I rely on time and again:
Post-Training Surveys: These are your bread and butter. Use a mix of question types like scales (1-10 ratings), multiple-choice, and a few open-ended questions like, “What was the most valuable part of this training?” and “What would you change for next time?”
Focus Groups: Get a small, representative group of trainees in a room (virtual or in-person) for an informal chat. This is where you can dig deeper into the “why” behind your survey scores. You’ll uncover insights here that you’d never get from a form.
Manager Check-Ins: Schedule brief check-ins with managers 30 and 60 days after the training. Ask them simple questions like, “Have you noticed your team members using the new X skill?” This is a great way to measure on-the-job behavior change (Kirkpatrick Level 3).
The big challenge today isn’t just collecting data, but doing it quickly. Historically, organizations would wait weeks for static survey results, which often meant a month’s delay just cleaning up fragmented data. That delay is a missed opportunity for timely fixes. Now, about 70% of organizations are shifting toward integrated platforms to get real-time insights and keep up. You can discover more insights about this shift toward continuous evaluation on Sopact.com.
Turning Data into Actionable Insights
Okay, so you’ve collected the data. Now what? The final and most important step is to analyze it and find the story hiding within. Don’t just report the numbers. Look for connections and patterns that tell you what to do next.
Start by asking questions of your data:
- Is there a correlation between low satisfaction scores and poor quiz results?
- Did one department show a bigger improvement in their KPIs than others? Why might that be?
- Do the open-ended comments consistently mention a specific module as being particularly confusing or helpful?
Organizing your findings effectively is key. Thankfully, a lot of modern training management software can automate much of this process. These tools often create dashboards that visualize trends, making it far easier to spot these important connections without spending hours buried in a spreadsheet.
By looking for these patterns, you move from just collecting feedback to truly understanding your training’s impact. This is how you figure out what’s working, what’s not, and exactly how to make your next training program even better.
You’ve done the hard work. You’ve gathered the surveys, tallied the assessment scores, and maybe even wrangled some candid feedback from managers. So, now what?
The real magic of measuring training is about learning, adapting, and getting better. This is where you close the loop and turn one-off training events into an engine for continuous improvement. You’ll build a learning culture that actually drives the business forward.
How to Talk to Leadership About Your Findings
Before you can tweak a single module, you often need buy-in from the top. And I’ve learned the hard way that a data dump in a spreadsheet is the fastest way to get your execs to tune out.
You have to tell a story with your data. Lead with the “so what?” right away. Don’t just say, “85% of participants passed the post-training assessment.” That’s a statistic. Frame it as a business outcome. “85% of our customer service team is now proficient in the new software, which we project will reduce average call handling time by 15%.” See the difference?
When you’re pulling your presentation together, remember to:
- Tie Everything to Business Goals: Every chart, every number should connect directly back to the original problems you were trying to solve.
- Mix Numbers with Narratives: Data provides the proof, but stories make it memorable. Share a powerful quote from an employee survey or a quick testimonial from a manager to bring the numbers to life.
- Be Upfront About Gaps: Don’t hide the parts that didn’t work. Showing where the training fell short demonstrates that you’re thinking critically, and it builds immense credibility. It proves you’re focused on improvement, not just on looking good.
This approach changes your report from a simple summary into a compelling business case for future investment.
Creating a Cycle of Real Improvement
This is the most critical part of the entire process. You use what you’ve learned to make the next training session even better. This is where the feedback loop snaps shut.
Did your data show one particular module was a total snoozefest? Maybe the delivery format just didn’t click with your remote team. These insights are gold, but only if you actually do something with them.
One of the most effective things you can do is hold a simple post-training review meeting. Get the instructor, a few participants, and their manager in a room (virtual or otherwise). Walk through the key data points and start asking questions.
The goal is to build a system where your programs constantly evolve and improve, guided by real-world evidence and feedback.
A Simple Framework for Your Review Meeting
I’ve found that a bit of structure prevents these meetings from turning into unstructured complaint sessions. Don’t just ask, “So, how did it go?” Use your data to guide a more focused conversation.
Here’s a three-part framework that keeps things productive:
1. What Worked Well?
Start with the wins. It gets the energy up and reinforces what you should keep doing. Use your positive data as a jumping-off point.
- Example Question: “Our satisfaction scores for the hands-on practice sessions were a 9.5/10. What was it about those sessions that made them so effective, and how can we bake that magic into other programs?”
2. Where Are the Opportunities?
Now, you can dig into the problem areas you’ve identified. This is where you get constructive.
- Example Question: “The data shows knowledge retention on Module 3 was 20% lower than the others. Any theories on why that might be? Was it too complex? Too boring? What could we change?”
3. What Are Our Action Items?
Never leave the meeting without clear, assigned next steps. Otherwise, all that great discussion just evaporates.
- Example: “Okay, Sarah will revise Module 3 to include more interactive examples, and she’ll have a draft ready by next Friday. And we’ve decided to send a follow-up microlearning quiz two weeks after the next session to boost retention.”
By systematically reviewing what worked and what didn’t, you guarantee that every training program you run is a little smarter than the last. This iterative approach is how you stop just reporting on training effectiveness and start actively improving it.
Answering Your Top Questions About Measuring Training

As you start digging into measurement, a few questions always seem to surface. I know they did for me. Let’s tackle some of the most common ones head-on so you can move forward with a clear plan.
When Should I Actually Start Measuring?
The simple answer? Immediately. But measurement is a process that unfolds in stages, capturing different insights at different times.
For instance, you’ll want to get a pulse on the immediate training experience right after a session wraps up. This is the perfect time for a quick post-training survey to capture gut reactions while they’re still fresh in everyone’s minds.
A week or so later is a great time to check for knowledge transfer with a short quiz or skills test. But tracking real behavior change requires a bit more patience. Your best bet is to check in with managers or do some on-the-job observation at the 30, 60, or even 90-day mark. This is when you’ll see if people are actually applying what they learned.
The big-picture business results? Those can take even longer, often surfacing in quarterly or semi-annual reports.
What if I Don’t Have a Budget for Fancy Tools?
This is a big one, and I’ve got good news. You absolutely do not need expensive, complicated software to get started. You can pull incredible insights from simple, low-cost tools you probably already have.
Here are a few ideas to get you going:
- For Surveys: Use free platforms like Google Forms or a basic SurveyMonkey account. They’re more than capable of handling your post-training feedback.
- For Qualitative Data: Don’t underestimate the power of a simple conversation. Informal interviews or small focus groups can tell you so much. A 30-minute chat with a handful of trainees can give you more context than a hundred multiple-choice questions ever could.
- For Behavior Observation: Create simple checklists for managers to use during their regular one-on-ones. This makes it easy for them to spot and track whether new skills are being put into practice.
The real secret isn’t the tool you use, but the consistency with which you use it. A simple, consistent process is infinitely more valuable than a complex, expensive system that gathers dust.
How Can I Prove It Was Our Training That Made the Difference?
Ah, the million-dollar question. It’s nearly impossible to prove your training was the only reason for an improvement, but you can build an incredibly strong case for it.
One of the most powerful ways to do this is with a control group, if your setup allows for it. Just measure the performance of a team that went through the training against a team that didn’t. The gap in their results can be a compelling piece of evidence for your program’s impact.
If a control group isn’t practical, look for powerful correlations. Let’s say your sales team’s closing rates jumped by 20% in the quarter immediately following a new sales technique training. If no other major variables changed, like a new marketing campaign or product launch, you’ve got a compelling story to tell.
And never forget the power of anecdotes. Backing up your hard numbers with testimonials from managers about specific, observable behavior changes makes your case personal and much more convincing.