
How to Audit LMS User Activity for Better Engagement

Auditing your Learning Management System (LMS) isn’t just about running reports. I think it’s the only real way to know if your courses are actually hitting the mark. It’s about digging into learner interaction data to uncover what’s working and what’s falling flat. I’m talking about things like completion rates, time spent on lessons, and where people get stuck.
This process takes you beyond vanity metrics like enrollment numbers and shows you the real story of how people are engaging with your content.
Why Auditing Your LMS Is a Game Changer for Engagement
You’ve poured weeks, maybe even months, into building an amazing online course. You want to see people succeed with it. But here’s the hard truth: just because learners enroll doesn’t mean they’re actually learning or enjoying the experience. Without looking at the data, you’re essentially flying blind.
An LMS audit gives you a clear window into how people interact with your material. It helps you answer the critical questions that enrollment numbers alone can’t touch.

Uncover the Real Learner Journey
Instead of just seeing a list of names, an audit shows you exactly where learners get stuck, which videos they rewatch, and what content they skip entirely. This kind of detailed insight is incredibly powerful for making targeted, effective improvements.
The data doesn’t lie. And it seems many organizations are catching on. Recent reports show that for 44% of organizations, measuring learning tech effectiveness through data analytics is now just as important as tracking overall usage rates.
Digging into this data is also fundamental to understanding user behavior, which is a key part of learning how to enhance customer engagement through data. It gives you exactly what you need to build a more compelling and effective learning path from start to finish.
Key Benefits of a Regular LMS User Activity Audit
Diving into your LMS user activity isn’t just about satisfying your curiosity. It’s a strategic move with direct, tangible benefits that help you refine and improve your entire learning experience.
Here’s a breakdown of what a consistent audit process helps you achieve.
| Benefit | What It Helps You Achieve |
|---|---|
| Pinpoint Engagement Bottlenecks | Discover the exact lessons or quizzes where users consistently drop off, allowing you to revise confusing or uninteresting content. |
| Identify Your Most Valuable Content | See which materials learners engage with the most, helping you double down on what works and create less of what doesn’t. |
| Improve Completion Rates | By removing roadblocks and enhancing popular modules, you create a smoother experience that encourages learners to finish the course. |
| Validate Your Course Design | Get concrete evidence that your instructional design choices are effective, or identify where they need to be rethought. |
Ultimately, a good audit helps you make smarter decisions that are backed by real user behavior, not just assumptions.
I think auditing your LMS data is about shifting from assumptions to evidence. It’s how you stop guessing what your learners want and start building a learning experience you know they’ll love.
This entire process is foundational to boosting learner motivation and, ultimately, their success. For more strategies on this, check out our guide on how to increase learner engagement for other practical tips.
Jumping straight into your LMS data without a clear plan is like trying to navigate a new city without a map. Sure, you’ll see a lot of things, but you won’t know what’s important or where you’re even supposed to be going.
A truly effective audit of your LMS user activity doesn’t start with a spreadsheet. It starts by asking the right questions before you even look at a single data point.
What are you actually trying to figure out? This is the most critical question. Maybe you’ve noticed a high drop-off rate in a particular compliance module and want to understand why. Or perhaps you’re just curious about which content formats your learners actually prefer, like video, text, or interactive scenarios.
Without a clear objective, you’ll just be gathering data for the sake of it. That’s a classic recipe for overwhelm and, ultimately, inaction.
Define Your Audit Goals and KPIs
Your goals will guide the entire audit process. First, think about what success actually looks like for your course or learning program. Once you nail that down, you can identify the Key Performance Indicators (KPIs) that will tell you if you’re hitting the mark.
These aren’t just random metrics you pull from a dashboard. They are specific, measurable data points tied directly to what you want to achieve.
Let’s look at a few common real-world scenarios:
- Goal: Increase course completion rates.
- KPIs: Overall completion percentage, average time to complete, and module-specific drop-off rates.
- Goal: Improve learner engagement with course materials.
- KPIs: Number of logins per week, average time spent on lessons, and interaction rates with non-essential resources (like bonus downloads or forum posts).
- Goal: Validate the effectiveness of a new quiz format.
- KPIs: Average quiz scores, number of retakes, and time spent on specific quiz questions.
By setting these upfront, you create a focused lens to view your data through. It helps you cut through the noise and zero in on the insights that really matter.
What Does an ‘Active User’ Even Mean?
Here’s a detail that trips up a lot of people. You need to define what an “active user” actually means for your program. This term is surprisingly subjective, and if you don’t define it properly from the start, it can skew your entire analysis.
For instance, is an active user someone who logs in once a week? Or is it someone who completes at least one lesson every three days? The right definition depends entirely on the structure and expectations of your course.
A self-paced, year-long certification program will have a very different definition of an ‘active user’ compared to a high-intensity, two-week cohort-based course. Get specific about your own benchmarks.
Defining this helps you create a baseline for what “good” engagement looks like. If you discover that only 20% of your users meet your own definition of active, you know you have an engagement problem that needs solving.
Map Out Your Data Sources
Finally, you need to figure out where you’re going to get all this information. Your Learning Management System is the primary source, of course, but the data can live in several different places. Taking a few minutes to map this out will save you a ton of headaches later.
Here are the usual suspects:
- Standard LMS Reports: Most platforms like LearnDash or Teachable have built-in dashboards. These are great for high-level numbers like completion rates, quiz scores, and basic user progress. This is your starting point.
- Raw Data Exports (CSV/Excel): For a deeper dive, you’ll almost always need to export raw data. This gives you granular details like timestamps for every single action a user takes, including every login, every lesson view, every click.
- xAPI or SCORM Data: If your content is built with these standards, you can get incredibly detailed interaction data. Think about things like how users answered specific questions, which part of a video they rewatched, or which path they took in a branching scenario.
- Server Logs: For the more technically inclined, server logs can reveal patterns about user sessions and system performance that aren’t available in standard reports. This is more advanced but can be a goldmine for troubleshooting.
This planning phase is what separates a truly useful audit from a pointless data-gathering exercise. It provides the structure and clarity you need to turn all those raw numbers into a clear story about your learners and what they need to succeed.
How to Extract and Analyze Your User Data
Alright, this is where we roll up our sleeves and get our hands dirty. The first, and most critical, step in any real audit is simply getting the data out of your LMS so you can actually work with it. The process can look a little different depending on your specific platform.
Some systems have fantastic built-in reporting dashboards that give you a great starting point. Others might require you to export everything into what I affectionately call a “messy CSV file.” Either way, the goal is to get that raw information into your hands.
This whole thing starts with a plan. You set your goals, define your KPIs, and then figure out what data you need to measure them.
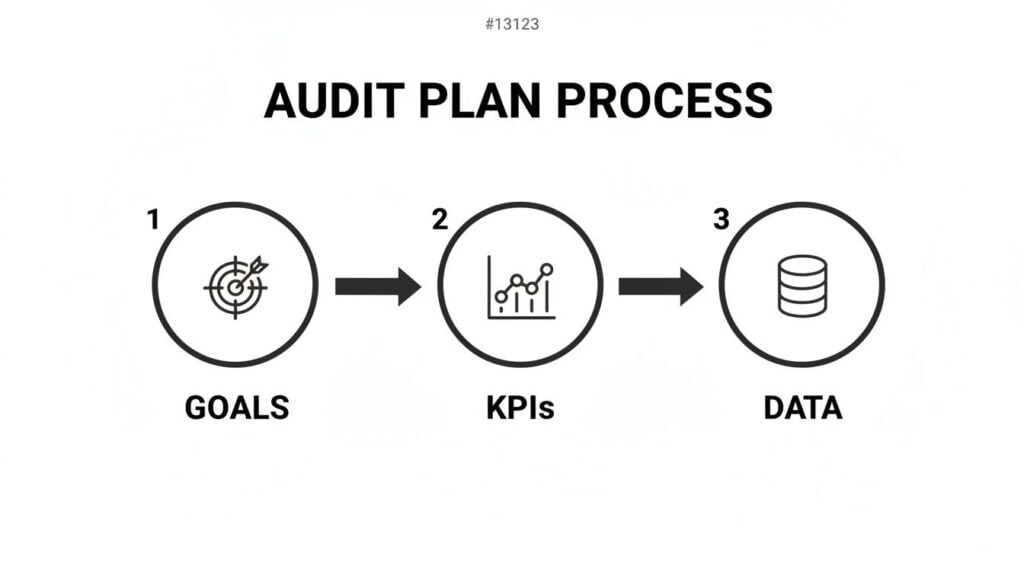
This visual really clarifies that a successful audit begins with a clear strategy before you ever touch a single spreadsheet.
The Critical First Step: Data Extraction
Let’s talk about the two main ways you’ll pull this information. Most modern LMS platforms offer some kind of built-in analytics, and these are perfect for getting a quick, high-level overview.
You can usually find pre-built reports for things like:
- Overall Course Completion Rates: The percentage of enrolled users who have finished a course.
- Quiz and Assessment Scores: Average scores, pass/fail rates, and sometimes even data on individual questions.
- Learner Progression: A snapshot of where users are in a course, showing which lessons they have or haven’t completed.
These reports are your best friends for a quick health check. For a truly deep and meaningful audit, however, you’ll almost certainly need to export your data. This is usually done as a CSV or Excel file and contains the granular, moment-to-moment activity logs.
This raw data is where the real magic happens. It shows you timestamps, user IDs, and specific actions taken, which is exactly what we need to spot the patterns that dashboards might miss.
Data Cleaning: The Unsung Hero
Once you have your data export, the next step isn’t analysis. It’s cleaning. This is probably the least glamorous part of the process, but I promise you it’s one of the most important. Raw data is often messy, and if you try to analyze it as-is, your conclusions will be completely off.
Data cleaning involves a few key tasks:
- Removing Duplicates: System glitches can create duplicate entries for the same action. It’s important to find and remove these to avoid inflating your numbers.
- Standardizing Formats: Make sure dates, times, and usernames are all consistent. One row might have “John Smith” and another “smith, john,” which your analysis tool will see as two different people.
- Handling Missing Data: You’ll likely find rows with empty cells. You need to decide how to handle these. Should you remove the entire row, or can you fill in the gap with a reasonable default value?
I can’t stress this enough. Spending an hour cleaning your data can save you from making bad decisions based on inaccurate analysis. Your insights are only as good as the data they’re built on.
The Fun Part: Analyzing Your Key Metrics
With clean data in hand, you can finally start looking for answers. The metrics you focus on should tie directly back to the goals and KPIs you set at the beginning. For instance, if your goal was to find confusing lessons, you’ll want to zoom in on drop-off points.
You can do this by sorting your data by lesson and user, then looking for the last lesson a user completed before they went inactive. If you see a dozen users all stopping at “Module 3, Lesson 2,” you’ve just found a major bottleneck.
This is where the power of an audit really shines. It tells you a story with the numbers. The massive increase in LMS adoption has made this kind of detailed analysis essential. With 83% of organizations now using an LMS, up from around 50-60% in 2016, managing huge user bases without deep activity insights is nearly impossible.
Spotting Meaningful Patterns
Beyond just single metrics, you want to look for connections and patterns. This is where you can uncover some really interesting user behaviors.
Here are a few things I always look for:
- Time-on-Task: How long are users actually spending on a lesson versus the expected time? A big difference could mean the content is either too easy or too difficult.
- Optional Resource Engagement: Are people downloading that “extra resources” PDF you included? If everyone is, it might be a sign that the core content is missing something.
- Quiz Attempt Patterns: Do learners retake a specific quiz multiple times? This could point to poorly worded questions or that the preceding lessons didn’t prepare them properly.
The specific data points available will depend heavily on your LMS and whether your content uses standards like SCORM or xAPI. To get a better sense of the kind of detailed interaction data you can get, you might be interested in our guide on SCORM vs xAPI and which you should use. Understanding these formats can help you plan for even more powerful audits in the future.
Your LMS is the heart of your operation, but let’s be honest, it rarely works in a vacuum. For most of us, it’s just one piece of a bigger puzzle that includes a community platform, an email tool, a CRM, and maybe our main website. A truly powerful audit connects the dots between all of them.
When you only look at LMS data, you’re only getting half the story. You might see a learner is falling behind, but you won’t see why. The real breakthroughs happen when you start tracking the entire student journey, not just their clicks inside a course module.
This is where you can start asking much deeper, more valuable questions about what really makes your audience tick.
Moving Beyond the LMS Dashboard
Think about it this way. Can you see a clear link between someone’s low course engagement and their lack of participation in your community? Or do learners who consistently open your weekly update emails tend to complete more lessons on time? These are the kinds of connections that can completely change how you run your business.
Isolating your LMS data creates frustrating blind spots. It’s a common pain point, and one of the biggest complaints from learners is when the systems they use feel disconnected. In fact, a staggering 52% of LMS users express dissatisfaction with systems that lack integration with their other tools. It’s a clear signal that a connected experience is critical.
A holistic audit helps you pinpoint these data silos that might be hurting the overall user experience on platforms like Circle.so or even your own custom-built community space.
Practical Ways to Connect Your Data
So, how do you actually do this? You don’t need to be a data scientist, but you do need a plan for bringing information from different places together. The goal is to create a single, unified view of each and every learner.
Here are a few practical places to start:
- Community Engagement: Pull data from your community platform (like Circle.so or Heartbeat) on user logins, posts, and comments. Compare this against their LMS activity. You might just find your most active community members are also your most successful students.
- Email Marketing Metrics: Look at open and click-through rates from your email provider (like ConvertKit or Mailchimp). Are learners who click on links to bonus resources in your emails getting higher quiz scores?
- Website and Blog Behavior: Using simple analytics, you can track if learners who read specific blog posts related to your course topics are more likely to finish the more advanced modules.
By combining these data sources, you’re no longer just auditing an LMS. You’re auditing the entire learning ecosystem you’ve built. This gives you a complete picture of what actually drives student success.
Before we go further, it’s helpful to have a quick-reference guide for what to look for and where to find it. This table breaks down some of the most essential metrics for your audit.
Essential LMS Audit Metrics and Tools
| Metric to Audit | What It Tells You | Common Tool or Data Source |
|---|---|---|
| Course Completion Rates | The overall effectiveness and engagement of your content. | Your LMS reports |
| Time-on-Task | How long learners are spending on specific lessons or activities. | LMS reports, xAPI/SCORM logs |
| Dropout Points | Which specific lessons or quizzes cause the most learners to quit. | LMS analytics, user activity logs |
| Quiz/Assessment Scores | How well learners are comprehending and retaining the material. | LMS assessment reports |
| Community Logins/Posts | How engaged learners are outside of the formal course content. | Circle.so, Heartbeat, Mighty Networks |
| Email Open/Click Rates | Whether your communications are resonating and driving action. | ConvertKit, Mailchimp, ActiveCampaign |
Think of this table not as a checklist, but as a starting point. The real magic happens when you start comparing metrics from the different columns to find patterns.
Building a Stronger Tech Stack
Connecting these dots helps you make much smarter decisions about your entire business. For instance, if you discover that community engagement is the single biggest predictor of course completion, you can double down on promoting it. Maybe you add prompts inside your lessons that encourage people to discuss key topics in the forum.
This integrated approach also helps you refine your technology choices over time. As you grow, understanding how all the pieces of your system work together is essential. If you’re looking to build or optimize your setup, our guide on choosing the right tech stack for a membership site can offer some valuable pointers.
Ultimately, auditing across your entire tech stack helps you serve your learners better. You can create a more seamless, supportive, and effective experience, one that makes them want to stick around long after they’ve finished that first course.
Turning Your Audit Insights into Action
You’ve done the heavy lifting. You’ve pulled the reports, sifted through the data, and spotted the patterns hiding in plain sight. Now for the most important part of any LMS audit. You have to turn all those numbers and charts into real, tangible improvements for your learners.
An audit that just sits in a folder is a missed opportunity. This is where we connect the dots and build a concrete plan to improve your courses, boost engagement, and make the whole learning experience better. Your data is about to become your roadmap.

From Data Points to Action Items
The first move is translating your findings into specific, doable tasks. Go back through your analysis, and for every key insight, ask a simple but powerful question: “So what?” This little question forces you to move from observation to implication.
Let’s walk through a few real-world examples to see how this plays out.
Finding: “There’s a huge drop-off rate after Module 4, Lesson 2.”
- Action Idea: That lesson is a red flag. Is it too long, overly technical, or just plain boring? Plan to either re-record it, break it into smaller micro-lessons, or add a downloadable summary sheet to support the core content.
Finding: “Learners who participate in our community forum have a 30% higher completion rate.”
- Action Idea: The community is clearly a secret weapon. We need to promote it more deliberately inside the course. Let’s add prompts at the end of key lessons encouraging discussion or asking learners to share their takeaways in the forum.
Finding: “An optional PDF checklist in Module 2 is being downloaded by over 85% of users.”
- Action Idea: This format is a clear winner. It’s time to brainstorm how we can create similar checklists or quick-reference guides for other modules to provide that same value.
This process transforms abstract data into a clear to-do list, which is the foundation of your entire improvement strategy.
Prioritize Your Plan with an Impact Matrix
Once you have a list of potential changes, you’ll probably feel a mix of excitement and overwhelm. You can’t do everything at once, which means you need to get smart about prioritizing. My go-to tool for this is a simple Impact/Effort Matrix.
It’s a straightforward framework for deciding what to tackle first. You just plot each of your action items onto a simple four-quadrant grid.
This matrix helps you move past gut feelings and make strategic decisions. It ensures you’re spending your valuable time on the changes that will give you the biggest bang for your buck.
Here’s how to think about each quadrant:
| Quadrant | Description | Your Strategy |
|---|---|---|
| High Impact, Low Effort | These are your quick wins, changes that are relatively easy to implement but will likely have a big, positive effect. | Do These First. This is your immediate priority list. |
| High Impact, High Effort | These are the major projects, like completely redesigning a module or adding a significant new feature. | Plan These Carefully. Schedule them as larger, longer-term initiatives. |
| Low Impact, Low Effort | These are the small tweaks that won’t move the needle much but are easy to knock out when you have a spare moment. | Fit These in When You Can. Don’t let them distract from bigger goals. |
| Low Impact, High Effort | These are the time sinks, tasks that will chew up a ton of work for very little reward. | Avoid These. Your time and energy are better spent elsewhere. |
This simple exercise will give you an incredibly clear and actionable roadmap. You’ll know exactly what to work on this week, what to plan for next month, and what to put on the back burner.
Implement and Monitor Your Changes
With your prioritized action plan in hand, it’s time to start making things happen. As you roll out each improvement, whether it’s updating a video or adding a new resource, it’s critical to treat it like a mini-experiment.
Don’t just launch the change and assume it worked. You need to close the loop by going back to the data.
Here’s a simple process I follow:
- Establish a Baseline: Before you touch anything, document the current metric. For example, note the exact completion rate for the module you’re about to fix.
- Implement the Change: Roll out your planned improvement to your learners.
- Wait and Measure: Give it enough time for a solid number of users to interact with the new content. Then, pull the same data again.
- Compare and Decide: Did the needle move? If that drop-off rate went from 60% down to 20%, you have a clear win. If it barely budged, it’s time to go back to the drawing board and try a different approach.
This final step is what turns a one-time audit into a cycle of continuous improvement. It’s how you consistently refine your courses based on real user behavior, ensuring they get better and more effective over time. This ongoing process is how a good learning experience becomes a truly great one.
Handling User Data and Privacy Responsibly
When we start digging into LMS user activity, we have to talk about something incredibly important: privacy. It’s easy to get lost in the spreadsheets and dashboards, but every single data point we analyze represents a real person who trusts us with their information.
Handling that trust responsibly isn’t just a box-ticking legal exercise. It’s the foundation of a healthy learning community.
Your learners need to feel safe. Regulations like GDPR in Europe and CCPA in California aren’t just suggestions, they set firm rules about how you collect, process, and store user information. Being upfront about what you track and why is the only way to build real trust.
Navigating Privacy with Respect
A great way to start is by anonymizing your data whenever you can. Instead of looking at “Jane Doe’s” progress, you can often aggregate the data to spot trends without compromising anyone’s privacy.
For example, you could analyze completion rates for a specific cohort or department rather than zeroing in on one person’s specific journey. This gives you the insights you need without making anyone feel like they’re under a microscope.
When you’re handling sensitive user data, it’s critical to stick to established privacy principles. Understanding general privacy principles gives you a solid framework for managing data responsibly. It’s all about creating a clear and honest data policy.
Your privacy policy shouldn’t be a wall of legal text designed to be ignored. It should be a clear, easy-to-understand promise to your users about how you’ll respect their information.
Here are a few practices I always come back to:
- Be Transparent: Clearly state what data you collect in a public-facing, easy-to-find privacy policy. No surprises.
- Limit Collection: If you can’t explain exactly why you need a piece of data to improve the learning experience, don’t track it.
- Secure Your Data: Make sure your LMS and any connected tools have strong security measures in place. A data breach can destroy trust in an instant.
Ultimately, respecting user privacy makes your audit more ethical and, frankly, more effective. When learners trust you, they engage more authentically, giving you better data and a stronger community.
Your LMS Audit Questions, Answered
I get asked about auditing LMS user activity all the time, especially from course creators who are just starting to really dig into their data. It’s a big topic, and honestly, it’s easy to feel a little lost at sea.
To help clear things up, I’ve pulled together the most common questions that land in my inbox. Think of this as your quick-start guide for those nagging questions you have right before you dive in.
How Often Should I Actually Be Doing This?
This is a great question, and the real answer is: it depends on your course’s intensity and how many students are going through it.
For a high-energy, cohort-based course that runs for just a few weeks, a weekly or bi-weekly audit is smart. You need to keep a close eye on engagement in near real-time to spot problems and make quick adjustments before a group of students gets left behind.
On the other hand, for a self-paced, evergreen course, a monthly audit usually hits the sweet spot. This gives you enough data to see meaningful trends without getting bogged down in the day-to-day noise. The most important thing is consistency. Whatever rhythm you choose, stick to it.
The goal is to create a regular feedback loop. You want to audit often enough to catch problems before they become massive issues for your learners, but not so often that you’re just staring at statistical noise.
If I Can Only Track One Thing, What Should It Be?
If I had to pick just one metric, it would be learner drop-off points. Hands down.
While completion rates are a great high-level indicator, knowing the exact lesson, quiz, or activity where users consistently bail gives you an incredibly actionable piece of information.
It’s the single most powerful metric for pinpointing specific content that’s confusing, boring, or just plain too difficult. Fixing that one bottleneck can create a huge ripple effect, improving your overall completion rates and student satisfaction. Most other metrics, like time-on-task or quiz scores, often lead you right back to this one anyway.
Do I Need a Bunch of Expensive Tools to Do This?
Absolutely not. While dedicated business intelligence (BI) tools can do some amazing things, you can get incredibly far with what you likely already have.
For anyone on a budget, this is the most powerful and accessible combo:
- Your LMS’s built-in reporting: This is your source for grabbing the raw data exports.
- A spreadsheet program: Tools like Microsoft Excel or Google Sheets are more than capable of handling the data cleaning, sorting, and basic analysis needed to uncover those key insights.
You don’t need a complicated or expensive tech stack to get started. Understanding how to audit LMS user activity is much more about the process and the questions you ask than the software you use. Start simple, master the fundamentals, and then you can think about exploring more advanced tools as your needs grow.