
How Do You Measure Webinar Success?

You’ve just finished hosting your latest webinar. The presentation went smoothly, people asked questions, and you got some positive feedback in the chat. But now you’re staring at your analytics dashboard wondering if it was actually successful. Sure, 150 people showed up, but what does that really tell you about whether your time and effort paid off?
The truth is, most people measure webinar success by looking at attendance numbers alone. It’s like judging a restaurant’s quality based only on how many people walked through the door, without considering whether they enjoyed their meal, came back, or recommended it to friends. Real webinar success goes much deeper than headcount.
Start With Your Why
Before you can measure success, you need to know what success looks like for your specific situation. This might seem obvious, but it’s surprising how many organizations skip this step and wonder why their webinar metrics feel meaningless later.
Different webinar goals require completely different approaches to measurement. If you’re trying to generate leads, you’ll care more about contact information quality and follow-up engagement than if you’re focused on educating existing customers. A product demo webinar should be measured differently than a thought leadership presentation.
These are tried-and-true, and chances are your webinar falls into one of these categories. Let’s break it down a bit further:
- Lead generation means focusing on registration quality, contact capture rates, and how well those leads convert down the funnel
- Brand awareness puts emphasis on reach, social sharing, and positioning your organization as a thought leader
- Product demonstrations require tracking demo requests, trial sign-ups, and pipeline progression
- Customer education calls for measuring learning outcomes, support ticket reduction, and satisfaction improvements
- Revenue generation needs monitoring of paid registrations, upselling opportunities, and customer lifetime value
The key insight here is that your measurement framework should align with your primary objective. You can track multiple metrics, but knowing your main goal helps you prioritize which numbers actually matter for decision-making.
What Happens Before Your Webinar Matters
Success starts building before you ever go live. Pre-webinar metrics give you early indicators of whether your event will hit its targets and help you make last-minute adjustments if needed.
Registration numbers are the obvious starting point, but raw totals don’t tell the whole story. You want to look at registration growth over time to understand momentum.
Are people signing up steadily throughout your promotional period, or did you see a big spike after a particular marketing push? This information helps you understand which promotional tactics work best and when to deploy them for future events.
The Importance of Your Landing Page
Your landing page conversion rate reveals how compelling your webinar positioning is to your target audience. Calculate this by dividing total registrations by total page visits. Industry averages hover around 20-30%, but this varies significantly by audience and topic. More importantly, track how this rate changes as you test different headlines, descriptions, or registration forms.
Traffic source analysis shows you which marketing channels deliver the highest quality registrants. Email might drive the most registrations, but LinkedIn could deliver more qualified prospects who actually show up and engage. Break down your cost per registration by channel to understand your most efficient promotional strategies.
Don’t forget to evaluate whether you’re attracting the right people. If your webinar targets marketing directors but most registrants are junior-level employees, you might need to adjust your messaging or promotional channels. Look at job titles, company sizes, and industries to ensure alignment with your ideal audience profile.
Live Event Performance Tells the Real Story
Once your webinar starts, you get access to engagement data that reveals how well your content resonates with attendees. These real-time metrics help you understand not just who showed up, but how engaged they were throughout the experience.
Attendance Rates and Patterns
Your show-up rate compares actual attendees to total registrations. Industry benchmarks typically range from 40-60%, though this varies by audience type and topic relevance.
More interesting than the overall rate is understanding attendance patterns. Do people arrive on time, or do they trickle in throughout the first 10 minutes? Are there geographic patterns based on time zones that suggest scheduling adjustments for future events?
Real-Time Engagement Signals
Modern webinar platforms capture multiple engagement indicators that go far beyond just logging in. Poll participation rates show how actively your audience engages with interactive content.
Question submission volume indicates genuine interest and helps you understand which topics resonate most. Chat activity, when managed well, creates community feeling and provides immediate feedback on your content.
The quality of engagement matters as much as quantity. Are people asking thoughtful questions related to your key messages, or are most questions basic clarifications? Are poll responses distributed across options, suggesting genuine consideration, or clustered around obvious answers?
Content Performance Analysis
Attention analytics reveal which parts of your presentation hold audience interest and where people start to disengage. Most platforms track average watch time and can show you drop-off points throughout your presentation. This data is invaluable for improving future content structure and pacing.
If you notice consistent drop-offs at the 20-minute mark, you might need to add more interactive elements or break up long sections with audience participation. Sharp attention increases during product demos suggest your audience wants more hands-on content.
What Happens After Matters Most
Post-webinar metrics often provide the clearest picture of actual business impact. This is where you discover whether your webinar moved people toward your desired outcomes or simply provided an hour of interesting content.
Recording performance extends your webinar’s lifespan and reach. Track how many people watch the replay, how long they engage with recorded content, and whether on-demand viewing drives additional conversions. Some of your best leads might come from people who couldn’t attend live but found value in the recording weeks or months later.
Follow-up engagement reveals how well your webinar motivated next steps. Monitor email open rates and click-through rates for post-event communications. Are people downloading additional resources? Are they visiting key pages on your website? High engagement rates suggest your content created genuine interest rather than just passive attendance.
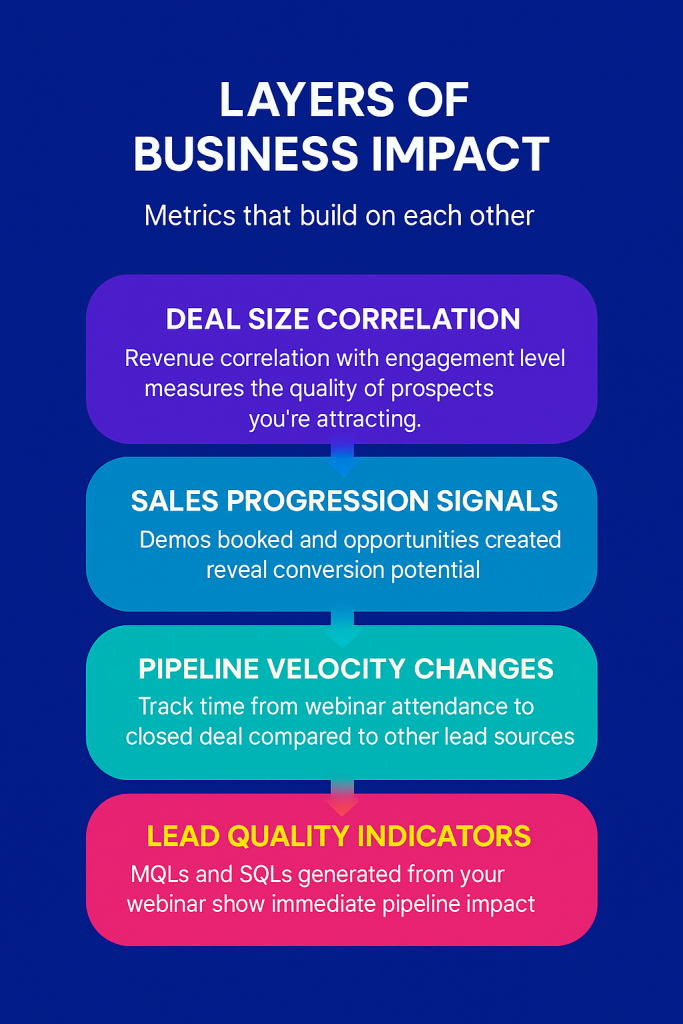
Here’s where the rubber meets the road for business impact. Think of these metrics as layers that build on each other:
Lead Quality Indicators
MQLs and SQLs generated from your webinar show immediate pipeline impact. These numbers tell you whether your content attracted genuinely interested prospects or just curious browsers.
Sales Progression Signals
Demos booked and opportunities created reveal conversion potential. When webinar attendees schedule follow-up meetings or request product demonstrations, you know your presentation motivated action beyond passive consumption.
Pipeline Velocity Changes
Track time from webinar attendance to closed deal compared to other lead sources. Many organizations find that webinar-generated leads move through the sales process faster because they’re already educated about the problem and potential solutions.
Deal Size Correlation
Revenue correlation with engagement level measures the quality of prospects you’re attracting. Attendees who participated actively in polls and Q&A often become higher-value customers than those who attended passively.
The most successful webinars create lasting relationships rather than one-time interactions. Track how many attendees join your email list and remain engaged over time. Monitor community participation increases in forums or groups. Look for referral generation from satisfied attendees who recommend your services to colleagues.
Learning From What People Actually Say
Numbers tell you what happened, but qualitative feedback tells you why it happened and how to improve. Post-event surveys provide context that pure analytics can’t deliver.
Design your surveys to capture both satisfaction ratings and open-ended insights. Ask specific questions about content quality, presentation effectiveness, and whether the webinar met expectations. Include Net Promoter Score questions to measure advocacy potential. “How likely are you to recommend this type of webinar to a colleague?” gives you a benchmark for audience satisfaction that translates to business growth potential.
The real value comes from analyzing feedback themes. Are multiple people requesting deeper dives into specific topics? Do several attendees mention wanting more interactive elements? Are there consistent suggestions about timing or format? This qualitative data guides strategic improvements that metrics alone might miss.
“The webinar was informative, but I wished we had more time for Q&A. The product demo was exactly what I needed to see.”
Comments like this reveal specific improvement opportunities and content preferences that help you design better experiences.
Tools That Make Measurement Possible
Effective measurement requires the right technology stack. Most webinar platforms include basic analytics, but connecting these tools to your broader marketing technology creates a complete picture of performance and impact.
Platform-native analytics from tools like Zoom, GoToWebinar, or Microsoft Teams provide real-time engagement data and basic conversion tracking. These built-in reports handle attendance, participation rates, and immediate post-event surveys reasonably well.
Integration with your CRM system transforms webinar data into actionable business intelligence. When your webinar platform connects to HubSpot, Salesforce, or similar tools, you can track long-term lead progression and revenue attribution. This integration enables automated follow-up sequences and helps sales teams prioritize outreach based on engagement levels.
Google Analytics adds another layer by tracking website behavior changes after your webinar. You can see whether attendees visit key pages, download resources, or progress through your conversion funnel at higher rates than other traffic sources.
Getting Better Over Time

The most valuable aspect of measuring webinar success is using that data to improve future performance. This requires systematic comparison and iteration rather than just collecting numbers.
Benchmark your results against both industry standards and your own historical performance. Industry averages provide context, but your own trend lines reveal whether you’re improving over time. A 45% attendance rate might seem low compared to industry benchmarks, but if your previous webinars averaged 30%, you’re clearly moving in the right direction.
Look for patterns across multiple events rather than making decisions based on single webinar results. Maybe your Tuesday afternoon time slots consistently outperform Wednesday mornings. Perhaps certain types of interactive content drive higher engagement than others. These patterns emerge only when you analyze data across multiple events.
A/B testing opportunities exist throughout your webinar process. Test different registration page headlines, email subject lines, or content formats. Try varying your interactive element frequency or question-asking timing. Small improvements compound over time when you systematically test and implement winning variations.
Three key areas for systematic improvement:
- Registration optimization through landing page testing, promotional timing, and channel effectiveness analysis
- Content refinement based on engagement patterns, attention analytics, and feedback themes
- Follow-up enhancement using conversion data, email performance, and sales progression tracking
The goal isn’t perfection in your first webinar, but consistent improvement over time through data-driven decision making.
Making It All Work Together
Measuring webinar success effectively means combining quantitative metrics with qualitative insights to create a complete picture of performance and impact. The specific metrics you prioritize should align with your primary objectives, but the measurement process itself creates learning opportunities that extend far beyond any single event.
Start with a focused set of key performance indicators rather than trying to track everything at once. Choose three to five metrics that directly relate to your main webinar goal, then gradually expand your measurement sophistication as your program matures and your objectives evolve.