
What Is the Average Online Course Completion Rate and Why Does It Matter?

The explosion of digital learning has made education more accessible than ever, but there’s a persistent challenge that both course creators and students face: the average online course completion rate remains surprisingly low.
Whether you’re creating courses or taking them, understanding these completion trends is crucial for success in the online learning landscape.
What Is the Average Online Course Completion Rate?
The average online course completion rate typically falls between 10% and 20%. This means that for every 100 people who enthusiastically sign up for an online course, 80-90 will never reach the finish line. These statistics have remained fairly consistent across different studies and platforms over recent years.
For professional certification courses, the average online course completion rate is somewhat higher, around 30% to 40%, but still significantly lower than traditional in-person education. These numbers represent a significant challenge for the e-learning industry and indicate that most online learners aren’t achieving their educational goals.
Understanding the average online course completion rate is the first step toward creating more effective learning experiences that actually deliver.
Why Analyzing Course Completion and Success Rates Matters for Institutions
Tracking and analyzing online course completion and success rates means you get a window into your students’ experiences and overall institutional health. By digging into these rates, colleges and universities can spot underlying trends that would otherwise fly under the radar.
For instance, consistently low completion rates in certain courses might indicate outdated content, confusing structures, or even a mismatch between student expectations and course delivery. Sometimes, you’ll notice patterns like students enrolling but never actually participating, which could point to registration hurdles or a lack of student engagement early on.
Regularly reviewing completion data allows faculty, administrators, and support staff to:
- Identify courses or departments with unusually high dropout rates.
- Uncover issues, such as unclear prerequisites or a lack of timely support.
- Track when and where students tend to disengage.
By openly sharing this information among instructors, advisors, and program coordinators, institutions can develop targeted strategies. This could mean introducing early-warning systems, updating course materials, or investing in academic support.
Ultimately, being proactive with course completion and success data empowers institutions to improve not just pass rates, but student satisfaction and institutional reputation as well.
Why Accurate Completion Data Matters for Decision-Making
Reliable and up-to-date completion data empowers both educators and administrators to make smarter decisions. Here are the three main ways this data is useful in the online learning context:
1. Early Intervention Is Possible
With accurate reporting, it’s easier to spot students at risk of falling behind or dropping out. Advisors and instructors can reach out with targeted support, whether that means extra office hours, nudging reminders, or connecting learners with additional resources before it’s too late.
2. Smarter Use of Time and Resources
Precise data streamlines reporting, reducing the need for time-consuming manual data crunching. This frees up time for staff to focus on high-impact tasks, such as curriculum improvements or student engagement strategies, rather than getting bogged down in spreadsheets.
3. On-Demand Insights Throughout the Semester
Having completion data accessible in one place means that progress can be tracked continuously, not just at the end of the term. Changes in learner engagement, course design tweaks, or support initiatives can be monitored in real time, allowing for agile adjustments that optimize outcomes.
By grounding reporting and planning in solid completion data, institutions are far better positioned to drive sustained improvements in online learning success.
Key Factors Affecting the Average Online Course Completion Rate
Research and experience have identified several critical factors that influence whether students complete their online courses.
Course Structure and Organization
Courses with clear, logical progression and manageable chunks of information tend to have higher-than-average online course completion rates. When students can easily navigate through content and understand how each lesson builds on previous ones, they’re more likely to stay engaged. Short, focused lessons of 5-15 minutes with clear learning objectives for each section work best.
Visual progress indicators also help students see how far they’ve come and what remains ahead, creating a sense of accomplishment that motivates continued progress.
Course Length and Time Commitment
The average online course completion rate drops significantly as course length increases. Short mini-courses often achieve completion rates of 40-60%, while comprehensive courses lasting 20+ hours might see rates below 15%.
This doesn’t mean longer courses are doomed to failure, but it does suggest that extensive content requires more thoughtful structuring to maintain engagement throughout the journey.
Engagement and Interaction Opportunities
Courses that incorporate interactive elements consistently outperform static, lecture-only formats when measuring the average online course completion rate. Human connection remains a powerful motivator, even in digital environments.
Discussion forums with active moderation, peer collaboration opportunities, live Q&A sessions, and direct feedback from instructors all contribute to a sense of community and accountability that boosts completion rates.
Content Quality and Presentation
The way information is presented dramatically impacts the average online course completion rate. Engaging, varied content keeps students interested and motivated to continue.
High-completion courses typically feature professional-quality video and audio, mixed media formats including video, text, and graphics, real-world examples and applications, and content that balances theory with practical skills. The presentation quality signals to students that the creator values their time and learning experience.
Student Motivation and Goals
The average online course completion rate varies significantly based on student motivation. Those with specific, goal-oriented reasons for taking a course (career advancement, required certification) are more likely to persist than those with casual interest.
Understanding student motivations can help course creators design experiences that align with and reinforce these goals throughout the learning journey.
External Factors and Life Demands
Even the most motivated students face obstacles. Work responsibilities, family obligations, and unexpected life events all affect the average online course completion rate by competing for students’ limited time and attention.
Courses that acknowledge these realities and offer flexibility in how and when students engage with the material often see better completion numbers.
Average Online Course Completion Rates by Platform Type

Different learning platforms report varying completion statistics based on their structure, audience, and approach.
Massive Open Online Courses (MOOCs)
Platforms like Coursera and edX report average online course completion rates between 5% and 15%. The free or low-cost entry point and massive scale contribute to these lower numbers. With thousands of students in a single course, personalized engagement becomes challenging, and the lack of financial investment makes it easier for students to walk away without feeling they’ve lost anything substantial.
Subscription Learning Platforms
Services like LinkedIn Learning and Skillshare see slightly higher average online course completion rates, typically in the 15-25% range. The subscription model creates some financial incentive for users to maximize their investment. These platforms also tend to offer shorter, more focused courses that align well with professional development goals, contributing to somewhat better completion outcomes.
Professional Certification Programs
Structured programs offering industry-recognized credentials achieve better-than-average online course completion rates, often between 30% and 45%. The clear professional benefit provides stronger motivation for completion. These courses often include more robust tracking systems and sometimes employer oversight, creating additional accountability that drives students toward completion.
Independent Course Platforms
Average online course completion rates on platforms like Teachable, Thinkific, and Podia vary widely (10-50%) based on instructor approach, subject matter, and implementation of engagement strategies. The most successful independent creators often achieve completion rates far above industry averages by implementing many of the strategies discussed in this article.
Strategies to Exceed the Average Online Course Completion Rate
Everyone wants to have a better completion rate for their course, but not everyone knows how to achieve it. I’ll explain in detail the strategies that you can use, but before I do, this infographic summarizes them at a high level:
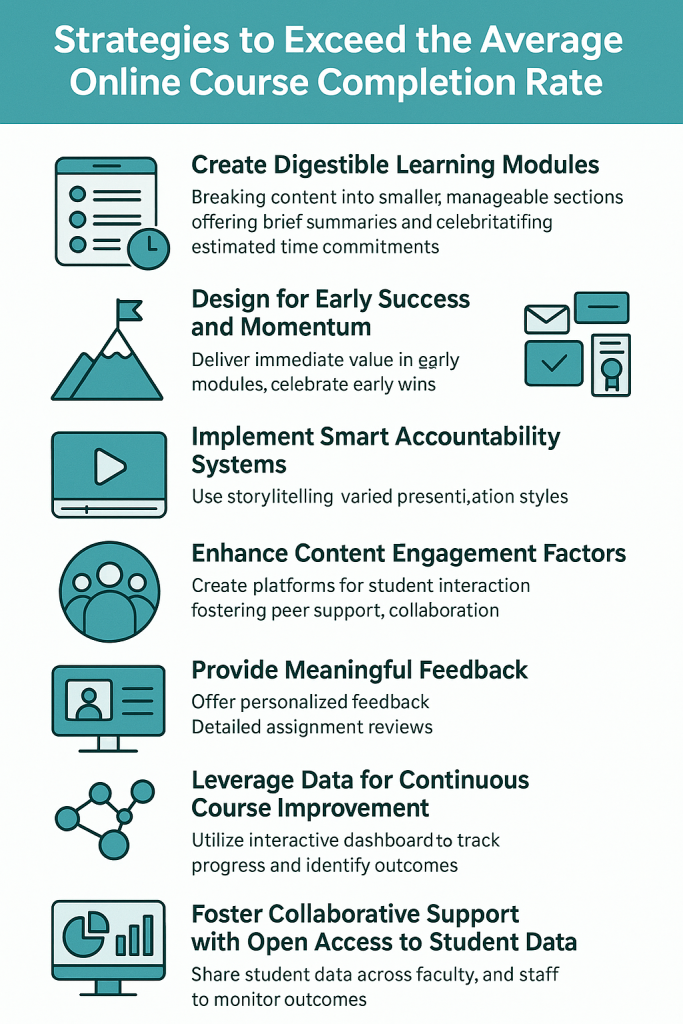
For course creators looking to beat the statistics, several proven approaches can significantly improve student completion.
Create Digestible Learning Modules
Breaking content into smaller, manageable sections helps students avoid feeling overwhelmed, which is a common reason for abandonment. Limiting modules to 5-7 lessons each and keeping individual lessons under 15 minutes makes progress feel more achievable.
You can include brief summaries at the end of each module which reinforces key concepts and creates a sense of closure before moving forward. Finally, providing estimated time commitments for each section allows students to plan their learning around busy schedules, making it more likely they’ll find time to engage.
Design for Early Success and Momentum
Courses that deliver immediate value in early modules see higher-than-average online course completion rates as students gain confidence and motivation.
Starting with achievable, practical skills that demonstrate immediate relevance to student goals builds confidence before introducing challenging concepts, and celebrating early wins and progress creates positive reinforcement that motivates continued engagement.
The psychological boost from early successes carries students through more difficult sections later in the course.
Implement Smart Accountability Systems
Accountability dramatically improves the average online course completion rate by providing external motivation and structure. Email check-ins for inactive students can gently remind them to re-engage. In addition, progress tracking with visual indicators shows advancement and creates a sense of accomplishment.
Also worthwhile are comletion certificates. Completion certificates and digital badges offer tangible rewards for achievement, while community recognition for milestone achievements leverages social motivation.
For maximum impact, some courses successfully implement accountability partners or small groups that create peer pressure to keep moving forward.
Enhance Content Engagement Factors
Creating genuinely engaging content demands thoughtful presentation that captures and maintains attention.
For example, storytelling to illustrate concepts makes abstract ideas concrete and memorable. Real-world examples and case studies demonstrate practical applications, while occasional humor and personality create a more human connection.
Also, by using varied visual elements and presentation styles, you prevent monotony, and interactive activities that apply concepts immediately reinforce learning and increase engagement.
Build Community Around Learning
The social element of learning significantly impacts the average online course completion rate. Courses with active communities consistently outperform those without.
Dedicated community platforms like Discord, Circle, or Facebook Groups create spaces for student connections beyond the course material.
Encouraging student introductions and connection opportunities fosters relationships that motivate continued participation.
Peer support and collaboration help students overcome obstacles together, while student spotlights and success stories provide inspiration and models for success.
Provide Meaningful Feedback
Personalized feedback shows students they’re not learning in isolation and helps them stay on track.
Video feedback at key milestones offers a personal touch that builds connection. Detailed assignment reviews help students understand their progress and areas for improvement.
Also, automated but personalized progress emails can scale feedback to larger student groups, while regular office hours or Q&A opportunities create space for direct interaction with instructors.
Leverage Data for Continuous Course Improvement
Ready access to real-time course data empowers instructors and administrators to track progress and intervene proactively throughout the semester.
When all relevant metrics live in a single, interactive dashboard, it becomes effortless to spot trends, identify at-risk students, and make timely adjustments to course pacing or support.
With the ability to generate reports on demand and visualize participation or completion rates, educators can make informed decisions rather than relying on intuition or waiting until final grades reveal problems.
This ongoing visibility supports a data-driven approach, streamlining interventions, measuring the impact of new strategies, and continuously refining the learning experience for better student outcomes.
Foster Collaborative Support with Open Access to Student Data
Transparent sharing of student data across faculty and staff unlocks a powerful tool for improving both course success rates and overall student outcomes.
When instructors, advisors, and department leaders have real-time access to student enrollment, attendance trends, and performance indicators, they can spot struggles before they escalate.
If, for example, a pattern of non-attendance or sudden drops in participation emerges, early outreach becomes possible, giving students the timely support or guidance that can turn things around.
Open access also streamlines communication between key stakeholders. Advisors can coordinate with instructors to address academic challenges or milestone achievements, while faculty can adjust instructional approaches or offer targeted interventions based on actionable insights rather than guesswork.
Ultimately, making data accessible ensures no one slips through the cracks, policies are guided by evidence, and proactive, community-wide efforts can collectively boost both retention and completion rates.
Common Obstacles to Completing Online Courses

Understanding why students drop out is crucial for addressing the low average online course completion rate. The obstacles students face are often predictable and addressable with thoughtful course design.
- Time management presents perhaps the biggest challenge for most online learners. Many struggle to fit course work into busy schedules, especially when courses require longer, uninterrupted study sessions.
- Motivation tends to fluctuate throughout the learning journey. Initial enthusiasm can quickly wane without systems to maintain engagement, especially when students encounter challenging material or concepts.
- Technical difficulties compound these motivation issues, frustrating platform experiences or technology problems can derail progress and discourage continuation, turning minor hurdles into permanent stopping points.
At the end of the day, some courses sometimes just fail to maintain relevance to student goals and expectations due to changes that occur in the subject area. You can’t build a course once, then expect it to work forever.
When the content doesn’t clearly connect to what students hoped to achieve, motivation to complete diminishes quickly. Successful courses continuously reinforce the connection between the current material and the student’s desired outcomes.
Reports That Can Deepen Your Analysis
When seeking a more complete picture of student success and course effectiveness, several complementary reports offer valuable insights:
- Enrollment and Headcount Data: Tracking changes in enrollment over time can reveal patterns tied to course popularity, accessibility, or institutional shifts. Comparing headcount across terms helps identify demographic trends or demand surges.
- Retention and Persistence Rates: These reports highlight how many students continue their studies term-to-term. Higher retention often points to effective course design and learner support, sudden drops can signal areas needing attention.
- Graduation Rate Analysis: Examining completion rates over multiple cohorts shines light on the ultimate effectiveness of academic pathways. Graduation data can surface longstanding bottlenecks or flag courses linked with student attrition.
- Disproportionate Impact Studies: Measuring how different student groups (such as first-generation college students, students from historically underrepresented backgrounds, or veterans) experience your courses identifies gaps in equity and inclusion.
By bringing these institutional reports together with course-level analytics, you gain a multi-layered perspective with how your course fits into the broader academic journey. This holistic approach uncovers actionable opportunities to support more students to the finish line.
Improving Your Own Course Completion Odds
As a course creator, you have significant influence over your completion statistics through intentional design choices. First, build scheduling supports into your course structure. Suggest specific time commitments, provide calendar templates, and even offer scheduling tools that help students block time for learning. Create a clear milestone structure with completion celebrations at key points to maintain motivation throughout the journey.
You should also incorporate practical application assignments that help students see immediate value from your content. These shouldn’t feel like busywork but rather meaningful opportunities to apply new knowledge.
One dependable strategy is starting with a shorter flagship course before expanding to more comprehensive offerings. This approach helps establish your reputation for delivering completable courses while building student confidence.
Finally, if possible, facilitate community development among your students through intentional connection opportunities. Create discussion prompts that encourage meaningful interaction, highlight student successes, and consider implementing an accountability partner system that pairs students with similar goals. The relationships formed become powerful motivators for course completion, often more effective than the content itself in driving students toward the finish line.
Final Thoughts
The average online course completion rate presents both a challenge and an opportunity for the e-learning industry. While current statistics might seem discouraging, they highlight areas where thoughtful improvements can make a significant difference. For course creators, focusing on engagement, structure, and student support can dramatically improve completion outcomes.
As the industry continues to mature, we’ll likely see innovative approaches in technology that continue to push completion rates higher, creating more effective learning experiences for everyone involved. However, technology isn’t the answer. The content itself needs to be created (and delivered) in such a way that encourages a learner to continue to the next lesson.