How to Measure Student Engagement That Actually Matters

You opened your dashboard this morning hoping for reassurance. Logins look healthy, a few lessons show solid watch time, and nobody has cancelled yet. Then a quiet member posts that she has felt lost for weeks, and someone who finished every module says he still can’t apply the material. I know that sinking feeling because I trusted tidy numbers for too long. Learning how to measure student engagement starts when you stop asking a single metric to do a job it can’t do.
Why Your Engagement Numbers Probably Lie to You
I’ve had a learner in a membership who logged in almost every day. On paper, she looked like a dream member. In reality, she was hunting for a worksheet she couldn’t find, replaying the same confusing lesson, and getting more frustrated each time.
That’s the trap. Logins, clicks, and watch time can describe movement without proving learning. A video can play while someone answers email. A long session can mean deep focus, or it can mean your navigation is awful.
What dashboards usually reward
Most platforms make visible activity easy to count, so that’s what gets charted. Participation showed up in 86.2% of studies in a systematic review of learning analytics measures, while time-on-task appeared in 45.9%, homework completion in 17.0%, attendance in 7.5%, and effort in only 6.3%.
Read that last number again. The thing we often care about most, real effort, is the thing we measure least because it’s harder to capture.
I started doing better once I borrowed a habit from outside education. Teams that coach frontline staff don’t judge performance from one score either, and these hotel team coaching and KPI tips make a useful reminder that a KPI only helps when it’s tied to observable work and a clear decision.
Think portfolio, not score
Now I keep a small evidence portfolio for engagement. I want activity, learning quality, emotional experience, and signs that learners are steering their own progress.
- Activity tells me: whether people showed up and kept moving.
- Work quality tells me: whether they’re thinking, not just clicking.
- Self-report tells me: whether the experience feels worthwhile, manageable, and welcoming.
- Choice tells me: whether they ask, suggest, retry, or pick a harder path without being pushed.
My rule now: If two kinds of evidence disagree, I believe the disagreement. That’s where the useful problem usually lives.
Good evidence feels less exciting than a big green score. It’s also much calmer. You can point to a specific lesson, a specific group, and a specific change worth testing, instead of celebrating traffic and hoping it means learning.
The Four Dimensions of Real Engagement
Before I track anything, I write down what each dimension means in my course. If I can’t define it in plain language, I won’t recognize it in data later.
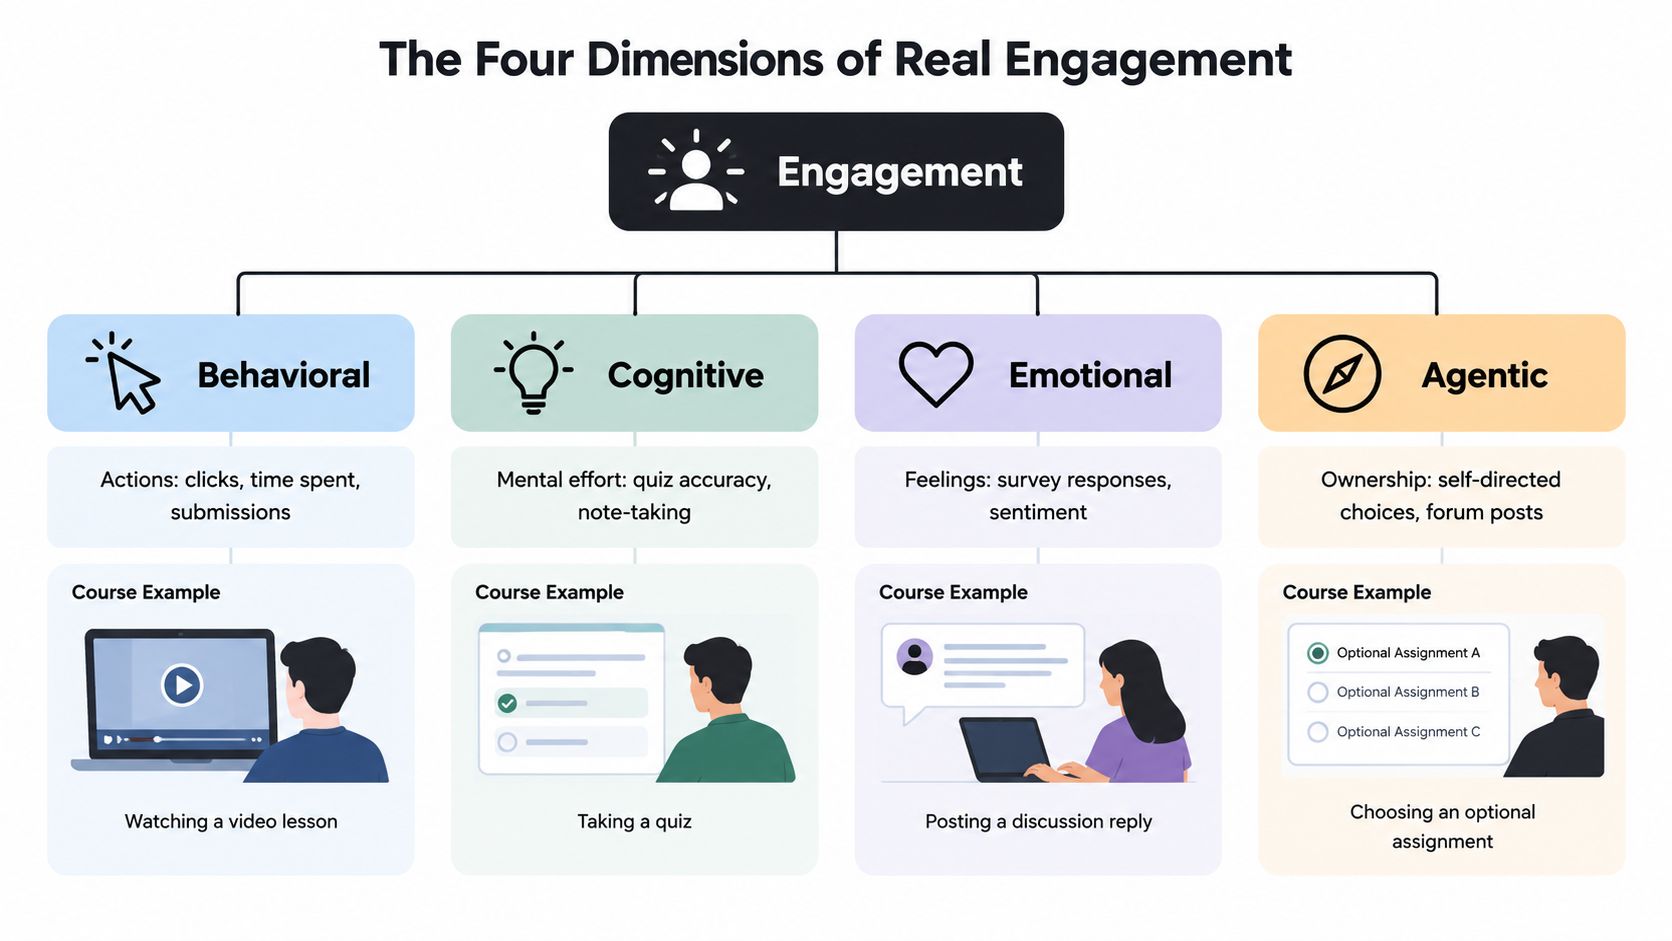
Here’s the visual I wish someone had handed me earlier.
A cooking club example
Say you run a membership cooking club. Maya watches the knife skills lesson, finishes the quiz, posts a photo of her practice board, and chooses the optional stock making assignment. She looks engaged across the board.
Jon also watches and completes everything. But his quiz answers are guesses, his reflection says the lessons feel rushed, and he never picks an optional challenge. His behavior looks fine while cognition and emotion are shaky.
That split is exactly why I separate behavioral, cognitive, emotional, and agentic engagement. Behavioral engagement covers participation, effort you can observe, attendance, and completion. Cognitive engagement covers strategic thinking and intellectual investment. Emotional engagement covers interest, curiosity, enjoyment, and belonging. Agentic engagement covers learners actively contributing to their own learning through choices, questions, and feedback.
We tend to overmeasure the first one. In a systematic review of engagement dimensions, behavioral engagement appeared in 88% of studies, cognitive in 76%, emotional in 52%, and agentic in just 24%.
Definitions you can paste into your planning doc
- Behavioral: The learner participates, completes tasks, attends, and persists in observable ways.
- Cognitive: The learner thinks strategically, connects ideas, explains reasoning, and invests mental effort.
- Emotional: The learner feels interested, curious, capable, and connected enough to keep going.
- Agentic: The learner shapes the experience by choosing, asking, contributing, and giving usable feedback.
I put social signals inside this map too. A thoughtful reply to a peer can show cognition and belonging. Hosting an informal study thread can show agency. What matters is naming what a signal can prove, and what it can’t.
Tracking Behavior Inside Your LMS and Community Tools
Behavioral data is still useful. I just don’t let it speak alone anymore.
In Teachable, Thinkific, Kajabi, or a similar LMS, I start with lesson completion, assignment submission, quiz attempts, and return visits after a failed attempt. In Circle, Discord, or Slack, I look at replies that add detail, questions that get resolved, and members helping each other. LearnStream covers LMS activity and reporting as part of its guidance for course and membership owners, alongside these platform tools.
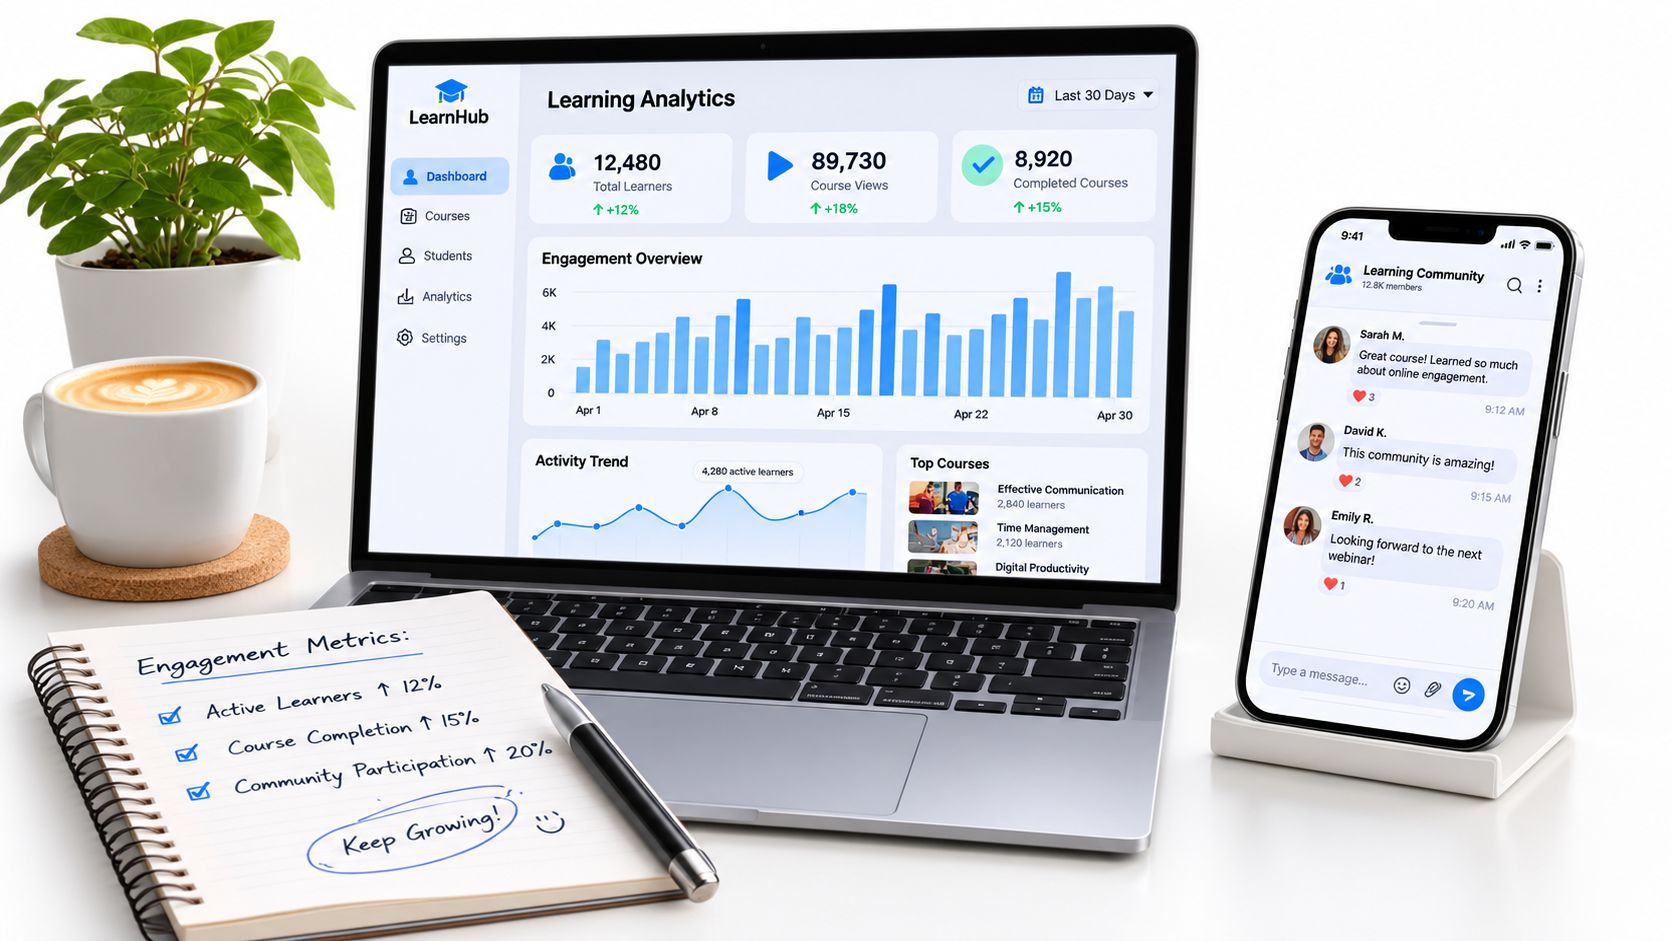
This workspace setup is close to how I review things, with exports next to handwritten notes.
Metrics I trust more
- Completion relative to available tasks: A learner finished most of what was open to them, not just a raw lesson count.
- Persistence after errors: They retried a quiz, revised work, or came back after getting stuck.
- Discussion depth: Replies explain, compare, or build on someone else’s idea instead of saying thanks and disappearing.
- Submission timing: Work arrives steadily, rather than in a last minute binge before access ends.
- Help seeking: Office hour questions and support searches can show active problem solving when the topic is specific.
If you’re choosing what a platform should surface, these member engagement platform features and KPIs are a handy comparison point. I also do a periodic cleanup using our guide on how to audit LMS user activity so old test accounts and staff logins don’t pollute the numbers.
Metrics I treat with suspicion
Raw time on page is my least favorite. Don’t compare it across a short reading, a long video, and a project brief as if they had the same expected duration. Use activity adjusted views instead, like completion against available work and what learners do after an incorrect answer.
That caution fits the research I lean on. In a 2019 study using the Scale of Student Engagement in Statistics, the behavioral factor accounted for 15.26% of total variance, while the overall engagement score predicted statistics proficiency at r = .21 (p = .01). Behavior matters, but it’s only part of the picture.
Set a baseline over two to four learning activities before you call any number good or bad. Your own course history is more honest than someone else’s benchmark.
Standardize each metric inside a cohort or course. A beginner foundations module and an advanced practicum shouldn’t be graded with the same raw expectations.
Designing Surveys That Capture Feeling and Effort
Surveys are where I hear what clicks can’t tell me. They’re also where I can annoy people fast if I’m careless.
I keep most check-ins to five to seven questions, send them after a module, and explain what I’ll change based on answers. Always-on surveys train people to ignore you. Short, well timed ones feel like a conversation.
A starter question bank
Use a simple scale from strongly disagree to strongly agree, then leave one open text box.
- Interest: This module held my curiosity.
- Challenge: The work was difficult in a productive way.
- Effort: I had to think hard and use strategies, not just follow steps.
- Belonging: I felt comfortable asking questions or sharing unfinished work.
- Clarity: I knew what to do next without hunting for instructions.
- Agency: I had a meaningful choice in how I practiced or showed my learning.
- Open prompt: What almost made you stop, and what helped you continue?
Those items cover affective engagement through interest and enjoyment, cognitive engagement through strategic effort, and a bit of agency through choice. That’s how I think about how to measure student engagement without turning a survey into homework.
Read the words around the scores
Numbers tell me where to look. Discussion tone tells me what it feels like to be in the room. Reflection prompts show whether learners can explain a decision, name a misconception, or connect this week to last week. Office hour questions reveal where confident language in the survey may be hiding confusion.
I review a small sample of work alongside survey results. If learners report high effort but reflections are thin, maybe the prompt rewards summarizing. If belonging is low but forum posts are frequent, maybe a few loud voices are doing most of the talking.
Our notes on how to manage course feedback surveys go deeper on timing and follow-up. The habit I care about most is closing the loop publicly. Tell learners what you heard, what you’re changing, and what you’re not changing yet. People answer more when their previous answers visibly mattered.
Self-reports have limits, including imperfect recall and a wish to sound positive. That’s fine. I’m using them to triangulate, not to crown a winner.
Building an Engagement Dashboard That Tells the Truth
My dashboard fits on one page. If it needs a tour, I won’t use it during a busy teaching week.
I keep four separate columns for behavior, emotion, cognition, and agency. I don’t blend them into one engagement score because a blended number hides the exact tension I need to see.
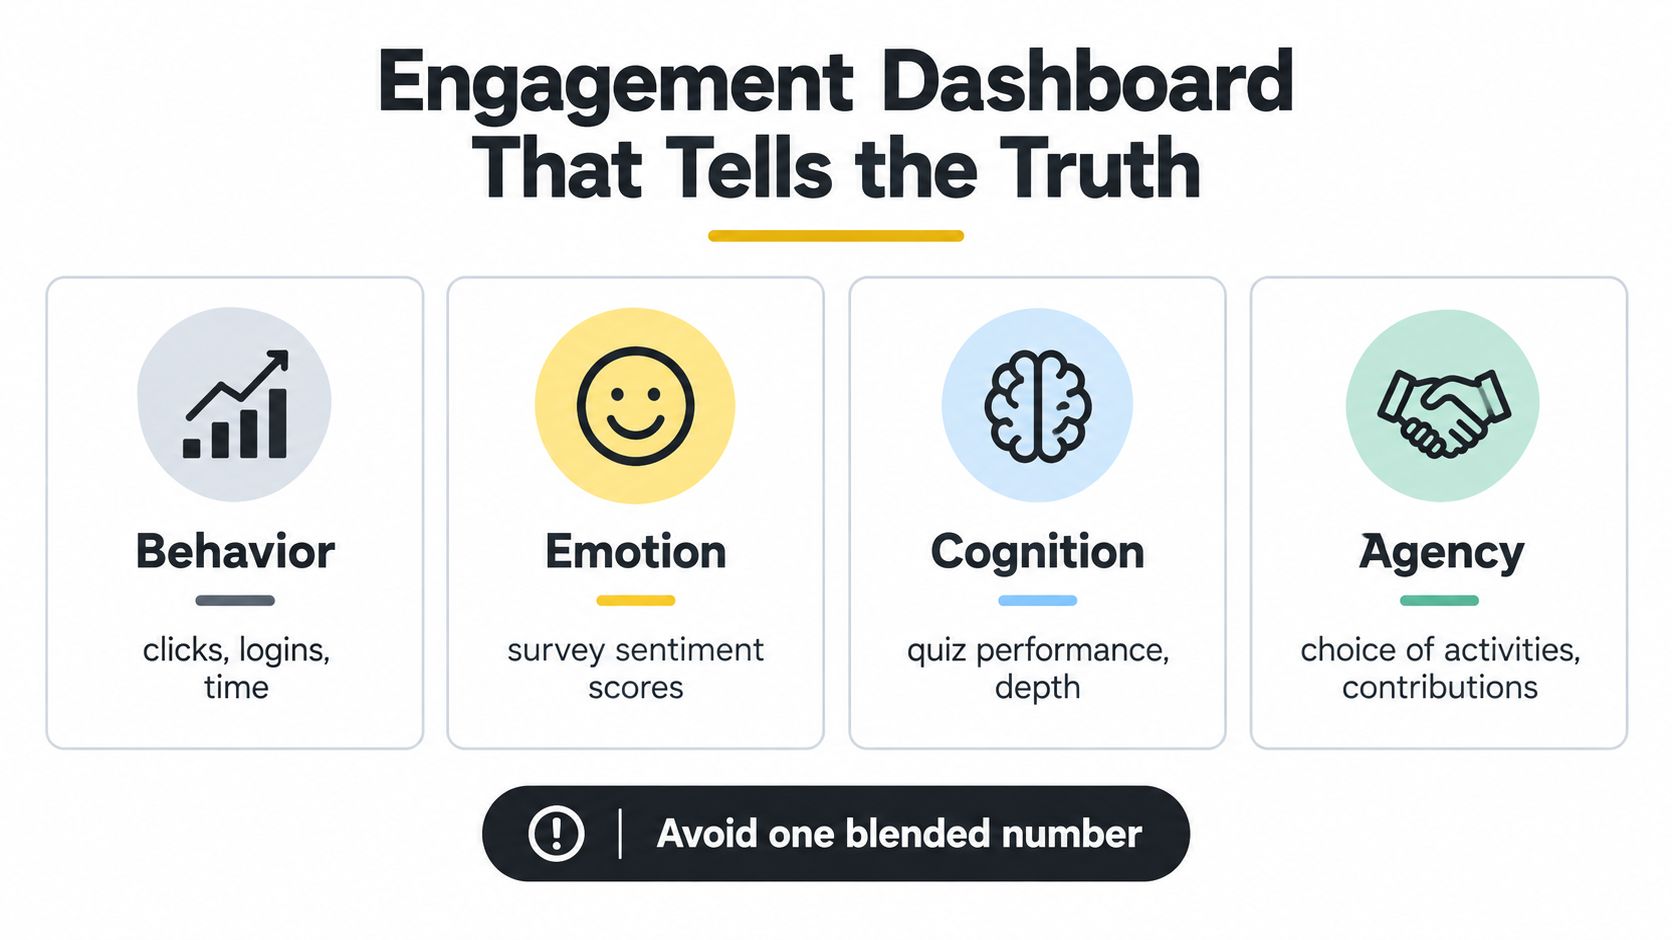
A layout you can copy
Sample Engagement Dashboard Layout
| Dimension | What to Track | Source | What Good Looks Like |
|---|---|---|---|
| Behavior | Completion, attendance, retry after errors | LMS and community exports | Steady progress against available tasks |
| Emotion | Interest, belonging, confidence | Post-module survey | Learners feel curious and safe to ask |
| Cognition | Explanation quality, quiz reasoning, revision | Work samples and assessments | Answers show strategy, not guessing |
| Agency | Optional choices, questions, suggestions | Forum, office hours, feedback | Learners shape practice and help peers |
You can build this in Notion, Looker, or a plain spreadsheet. I stole some reporting discipline from fields that review KPIs under pressure, and this sales engineering KPI reporting guide is a good reminder to pair every metric with an owner and a decision. For the LMS side, our primer on LMS reporting dashboards for beginners explains common report types in plain language.
Always show coverage
Every survey result on my dashboard sits next to its response rate and sample size. A happy score from a tiny slice of learners is a lead, not a conclusion.
The National Survey of Student Engagement essentials and response history shows an average institutional response rate of 38% in 2010, dropping to 30% by 2018. That decline is a warning I take seriously. If the people who answer differ from those who don’t, your result can drift without learning changing at all.
I also disaggregate by cohort, start date, and access path when numbers are large enough to protect privacy. Then I write one sentence under the dashboard. What changed, what might explain it, and what I’ll test next. Without that sentence, it’s just colorful storage.
Measuring Engagement Without Biasing the Results
I get nervous when a tool promises objective engagement from a camera. A face can look blank because someone is concentrating. A learner may keep video off because of bandwidth, disability, work, family space, religion, or simple preference.
Eye tracking and facial expression tools can also be thrown off by lighting and background noise. Even when the tech works as designed, I still need consent, transparency, data minimization, and human review. Otherwise I risk punishing quiet participation that is thoughtful work.
Lower tech options that hold up
For live sessions, I prefer systematic interval observation. Define target behaviors first, like listening, effort, question asking, persistence, and enjoyment. Then sample in fixed intervals and score only what you can observe.
A published observational study using five-minute coding intervals reported internal consistency of α = 0.79, inter-rater reliability between 0.81 and 0.85, and intra-rater reliability between 0.79 and 0.86. I treat those as quality benchmarks, not promises.
Train observers on shared examples. Pilot the rubric. Double-code some intervals and report disagreement instead of pretending one percentage settles it. Percent agreement alone can flatter you, so chance corrected statistics matter when you’re making serious claims.
Fairness checks I actually do
- Offer non-digital routes: Brief experience sampling, structured interviews, and accessible survey formats keep camera refusal from becoming a penalty.
- Separate compliance from cognition: Sitting still and nodding don’t prove deep thinking.
- Rotate observation times: Don’t only observe your best live session and call it typical.
- Report uncertainty: Say when a group is small, a survey response is thin, or raters disagreed.
Quiet is data, but it isn’t a verdict. Ask what quiet means in this context before you label a learner disengaged.
Good measurement should help you teach more fairly. If a method systematically misreads assistive technology users, global learners, or people with limited bandwidth, it isn’t rigorous. It’s just automated bias with a chart attached.
Your 30-Day Engagement Measurement Plan
You don’t need a research department to start. You need four focused weeks and the discipline to change one thing at the end.
I like sketching the rollout where my team can see it, like this planning board.

The four weeks
- Week one, map dimensions: Write your definitions for behavior, cognition, emotion, and agency. Assign each current metric to one dimension and delete duplicates.
- Week two, instrument behavior: Pull completion, persistence after errors, and discussion depth for two to four activities. Set your baseline inside that cohort.
- Week three, run one survey: Send a short post-module survey and read a small sample of reflections or assignments beside it.
- Week four, review and adjust: Build the four column dashboard, add response rates, pick one instructional change, and date your next review.
If you want a walkthrough to play while you set up your sheet, this video pairs well with the week two work.
Keep and avoid list
Keep separate dimension scores, baselines, work samples, and coverage rates. Avoid single blended scores, raw time comparisons across unlike activities, camera based labels, and surveys you never act on.
Revisit the plan after a major course redesign, a new cohort type, or a platform change. That’s when old baselines stop meaning what you think they mean.
Pick one module this week and build its four column portfolio before you touch anything else. Write the definitions, pull the behavioral baseline, draft six survey questions, and schedule your review date. Then make one small teaching change from what you find, and measure again. That’s how engagement stops being a vague worry and starts becoming useful evidence.