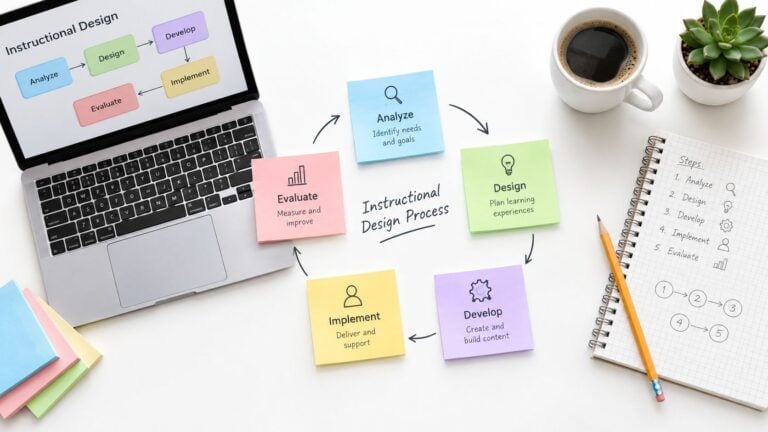
Learning Outcomes Measurement: A Practical Guide

You’ve launched the course. The lessons are published, enrollment is moving, and your LMS is recording clicks, completions, and quiz attempts. Then someone asks the question that exposes the gap: What did learners achieve, and what evidence do we have?
Many teams can answer how many people enrolled or finished. Far fewer can show whether learners can apply the intended skill, whether performance changed afterward, or whether the assessment treated different learner groups fairly. That gap is where learning outcomes measurement becomes practical rather than administrative.
A reliable system starts before launch. You define outcomes, choose evidence, connect the data sources, test the scoring process, and decide which findings will trigger a program change. The result is a measurement pipeline that supports better decisions instead of a report assembled after the evidence has disappeared.
Why Most Learning Programs Fly Blind
A course creator finishes recording on Friday and publishes on Monday. The team has spent weeks polishing slides, configuring modules, and writing promotional emails. Nobody has agreed on what “success” means beyond enrollment and completion, so the LMS starts collecting activity data without a measurement plan behind it.
That pattern is common because content is visible and measurement infrastructure is mostly invisible. Deadlines reward publishing. Assessment design requires different expertise, and teams often assume that a completed module represents learning. It doesn’t. A learner can watch every lesson, pass recognition-based quiz questions, and still struggle to perform the target task independently.
The cost of starting with content
Suppose a customer training program aims to help users configure a product correctly. The team tracks video completion and a final satisfaction survey. Those figures may show that learners reached the end and enjoyed the experience, but they don’t reveal whether configurations were accurate, whether support requests declined, or whether learners could recover from a realistic error.
Completion can still be useful. It tells you something about access and participation. Satisfaction can also help identify confusing instructions or poor pacing. Neither metric, on its own, demonstrates the intended outcome.
Practical rule: Every important outcome needs a planned piece of evidence, and every piece of evidence needs an intended decision.
Why retrofitting measurement fails
After launch, teams often discover that learner IDs don’t match across the LMS, CRM, support platform, and analytics environment. Baseline performance wasn’t captured. The final assessment measures recall even though the course promised workplace application. Raters interpret the rubric differently, making scores difficult to compare.
Retrofitting can repair some gaps, but it can’t recreate evidence that was never collected. A pre-launch plan lets you define the outcome, instrument the relevant events, and establish a comparison point before learners enter the program.
Global participation makes this infrastructure more important. UNESCO reports that the worldwide gross enrolment rate in higher education rose from 19% in 2000 to 40% in 2020. As more learners, institutions, and delivery contexts need comparable evidence, attendance and credit counts become less useful proxies for what people learned. UNESCO’s assessment framing treats assessment as a system-level way to understand, measure, and improve quality and equity.
The Three Pillars of Trustworthy Measurement
A measurement system earns trust through validity, reliability, and fairness. These qualities work together. An assessment can produce consistent scores and still measure the wrong skill. It can measure the right skill but disadvantage learners through unnecessary language demands or inaccessible formats.
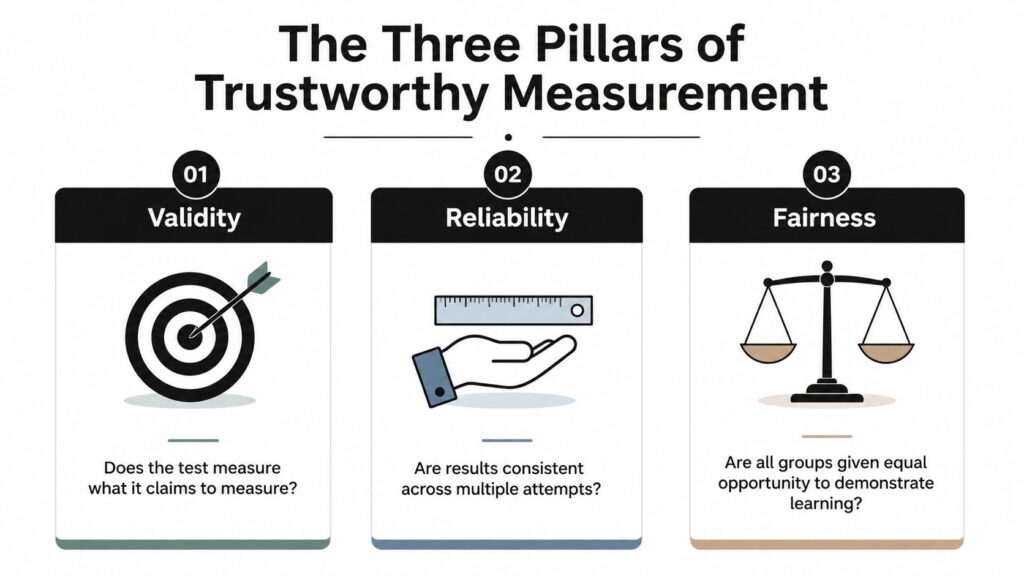
Validity asks whether the evidence answers the right question
Validity means the assessment supports the interpretation you want to make. If the outcome says learners will implement a process, a multiple-choice test about definitions provides limited evidence. It may measure recognition, but it doesn’t directly show implementation.
Start by writing the decision the assessment will support. If the decision concerns safe execution, collect a performance artifact, simulation, observation, or work sample. Then check for construct-irrelevant barriers. A complicated reading passage shouldn’t determine whether someone can complete a visual configuration task unless reading comprehension is part of the outcome.
A simple review question helps: If a learner earns a high score, what can I confidently say they can do? If the answer goes beyond what the assessment requires, the instrument is overclaiming.
Reliability protects consistency
Reliability concerns stability across uses, occasions, and raters. A learner’s result shouldn’t depend mainly on which assessor reviewed the work or which version of an equivalent task appeared.
For subjective work, use a rubric with observable criteria and examples of performance levels. Train raters on sample artifacts, discuss disagreements, and test the rubric before the live assessment. The Truckee Meadows Community College guidance on reliability and validity identifies clear outcomes, aligned scoring rules, rubric testing, and rater agreement as practical ways to improve interrater reliability. One formula used in assessment work is interrater reliability = number of agreements / number of possible agreements.
Fairness checks who gets a genuine opportunity
Fairness requires more than applying the same instructions to everyone. Learners may differ in language background, disability access, technology, prior experience, or familiarity with the assessment format. Remove barriers that aren’t part of the skill being measured, while preserving the parts that matter.
Review instructions for unnecessary cultural assumptions. Test the assessment with learners who use assistive technology. Offer equivalent ways to demonstrate the outcome where appropriate, such as typed responses, recorded explanations, or live demonstrations.
For a broader perspective on how engagement mechanics can affect learning evaluation, compare your assessment assumptions with these findings on gamified learning in 2026. The useful question isn’t whether a feature looks engaging. It’s whether the evidence still represents the intended learning for the people using it.
Turning Vague Goals into Measurable Outcomes
“Learners will understand data privacy” sounds reasonable, but it gives an instructional designer almost nothing to score. What should learners recall, explain, apply, or produce? Bloom’s Taxonomy helps answer that question by moving from vague intention to observable action.
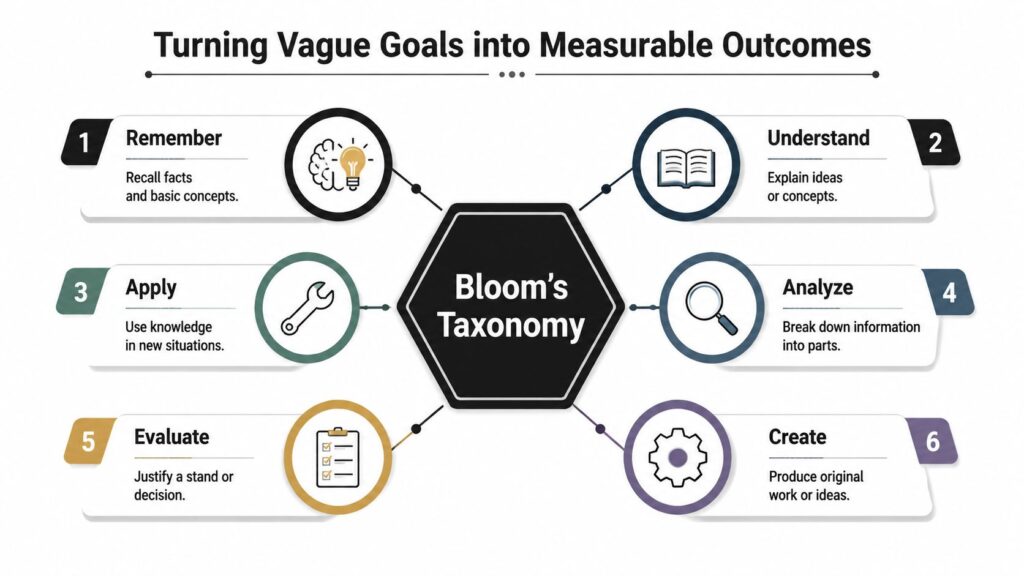
Choose the cognitive level first
The revised taxonomy uses six levels:
- Remember: Learners can list terms, identify steps, or recall rules.
- Understand: Learners can explain an idea in their own words or summarize a process.
- Apply: Learners can implement a method in a new but relevant situation.
- Analyze: Learners can compare components, distinguish causes, or break down evidence.
- Evaluate: Learners can justify a decision using stated criteria.
- Create: Learners can design, produce, or revise an original solution.
Each level calls for different evidence. A list can demonstrate recall. A scenario response may show application. A project, critique, or design brief can provide evidence for creation. Asking learners to select an answer from a menu won’t adequately demonstrate every level.
University guidance on Bloom’s Taxonomy and measurable learning objectives recommends specific verbs such as list, explain, implement, compare, justify, and design, rather than “understand” or “appreciate.”
Rewrite the outcome, then align the assessment
Use this sequence:
- Name the learner and task. Write what the learner will do, not what the course will provide.
- Select one observable verb. Avoid combining several skills unless you intend to assess each one.
- Add the conditions. State the scenario, tools, constraints, or resources.
- Define acceptable performance. Describe the quality, accuracy, completeness, or reasoning required.
- Choose matching evidence. Build the assessment around the action in the outcome.
A weak statement says, “Learners will understand customer segmentation.” A stronger version says, “Given a customer dataset, learners will compare two segmentation approaches and justify a recommendation using stated business criteria.”
Another weak statement says, “Learners will appreciate secure password practices.” A measurable version says, “Learners will implement a secure password and authentication setup in a simulated account, then explain the choices made.”
For a practical distinction between objectives and outcomes, use this guide to learning objectives versus outcomes. It can help teams keep instructional intentions separate from evidence of achievement.
The following video offers another way to introduce Bloom’s levels during planning:
Choosing Between Qualitative and Quantitative Metrics
Numbers and narratives answer different questions. Quantitative metrics help you see patterns, compare groups, and monitor movement at scale. Qualitative evidence helps you understand how learners reasoned, where they struggled, and whether they transferred the skill to a real setting.
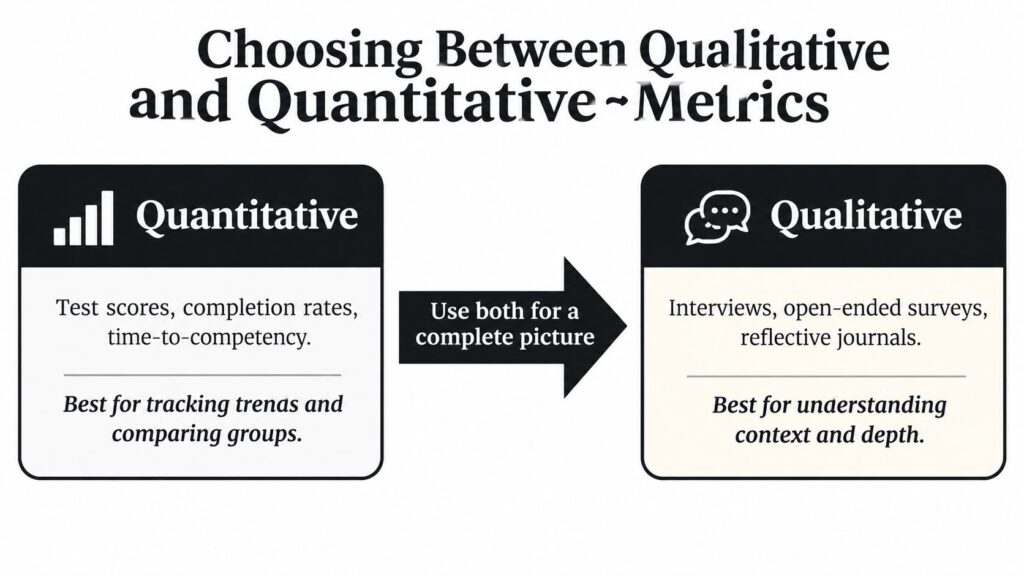
| Measurement type | Useful examples | Decision it supports |
|---|---|---|
| Quantitative | Test scores, completion rates, time-to-competency | Whether performance is changing, where participation drops, and how cohorts compare |
| Qualitative | Interviews, open-ended surveys, reflective journals, portfolios | Why performance looks the way it does and how learners apply knowledge |
| Combined | Score patterns paired with artifacts or observations | Whether a numerical change reflects meaningful learning |
Use quantitative data for patterns
A score distribution can reveal that one outcome is consistently weak. Completion data can show where learners stop participating. Time-to-competency can help a training team examine whether learners reach a defined performance standard efficiently.
These metrics become useful when the outcome and threshold are clear. A dashboard full of views, clicks, and quiz attempts may look precise but still fail to show capability. Quantitative data supports a decision only when the metric has a clear relationship with that decision.
Use qualitative evidence for meaning
Learner reflections can reveal a misconception that a score alone hides. A portfolio can show whether work quality improved across revisions. A manager observation can indicate whether a workplace behavior appeared after training.
Qualitative evidence needs structure. Use a prompt tied to the outcome, a rubric for artifacts, or an observation guide with defined behaviors. A set of unstructured comments is difficult to compare and easy to overinterpret.
The same principle appears in hiring assessment. A resource on criteria scoring for sales hiring is useful because it illustrates how defined criteria turn subjective judgments into more consistent evaluations. The method transfers well to learning artifacts, provided the criteria describe the intended outcome rather than a preferred personal style.
Avoid treating surveys as a substitute for performance evidence. A learner may report confidence without being able to complete the task, or perform competently while feeling uncertain. Use feedback to diagnose the experience, then pair it with direct evidence of learning.
Teams designing surveys can also use this guide to managing course feedback surveys to keep questions focused and connected to decisions.
Building Your Measurement Infrastructure
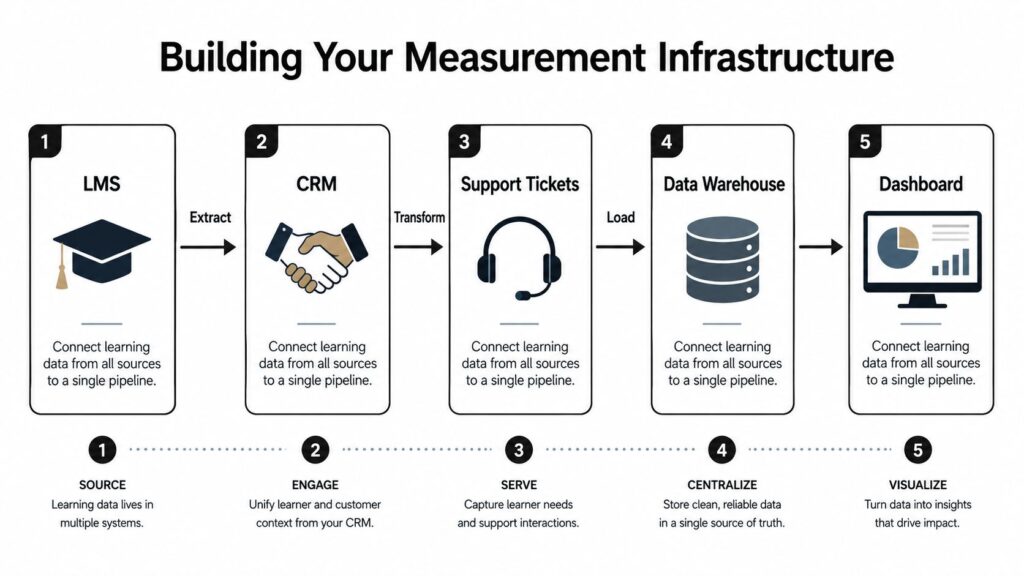
Learning data usually starts in several places. The LMS records enrollment, progress, assessments, and submissions. A CRM holds account, role, and customer context. Support tickets show recurring problems, while customer-success records may contain adoption notes and outcome reviews. An analytics environment is where those signals can be combined.
Design the pipeline before the first learner arrives
Begin with a data dictionary. Define the learner, cohort, program, outcome, assessment attempt, completion event, and performance result. Give each object a stable identifier that can connect records without relying on names or manually entered labels.
Then map each outcome to its evidence and source:
- LMS: Outcome-linked assessments, submissions, attempts, progress, and timestamps.
- CRM: Learner role, account context, enrollment source, and relevant program status.
- Support system: Ticket category, issue type, resolution, and relationship to trained tasks.
- Customer-success records: Adoption observations, review notes, and follow-up evidence.
- Analytics layer: Cleaned tables, joins, cohort views, and decision dashboards.
A simple extract, transform, and load process can move records into a warehouse or analytics layer. The technical design matters less than the discipline of defining what each event means before implementation.
Prevent the usual integration failures
Teams often create dashboards before agreeing on definitions. One group calls a learner “complete” after the final video, while another requires the assessment. The dashboard then reports a clean number that nobody interprets consistently.
Other problems include duplicate learner records, missing cohort dates, inconsistent outcome labels, and assessment results that can’t be tied to a specific version of the rubric. Establish ownership for each field and document changes. Protect personal data through minimization, access controls, and clear retention practices.
Infrastructure principle: A dashboard can display disconnected data beautifully. It can’t make disconnected data comparable.
Integration was identified as the number one measurement challenge in the 2026 education-led growth report. The same report says the share of organizations not consistently measuring impact fell from 28% to 5%, and 49% begin measuring within three months of launch. Those figures point to a useful operational shift, measurement increasingly starts near program design rather than being postponed indefinitely.
For teams new to reporting architecture, this explanation of LMS reporting dashboards provides a practical starting point. Keep the first dashboard small. It should answer a defined set of decisions, not display every event the platform can export.
Your Pre-Launch Measurement Checklist
A pre-launch plan should be specific enough that another person can operate it. It should also be light enough to maintain after launch. I use the following sequence when a team needs evidence from the first cohort.
1. Define the outcomes
Write three to five outcomes with Bloom’s action verbs. Each should describe a learner action, the relevant context, and the performance standard. If you can’t imagine what a successful artifact or behavior would look like, the outcome still needs work.
2. Match evidence to each outcome
Choose a direct assessment for every important outcome. Use a demonstration for a procedural skill, a scenario for decision-making, a written explanation for reasoning, or a project for design work. Add a short diagnostic or baseline task when you need to compare performance before and after the program.
3. Build and test the rubric
Create criteria that describe observable performance. Include examples where raters might disagree. Have more than one reviewer score sample work, discuss differences, and revise ambiguous wording before launch. The SUNY assessment certificate program describes a useful cycle, develop a rubric, apply it, review implementation, and refine it.
4. Instrument the data collection
Confirm that the LMS captures outcome, assessment version, learner identifier, attempt, score, and timestamp. Decide which CRM, support, or customer-success fields will provide context. Document the data owner, refresh process, and access rules.
5. Establish the baseline
A baseline can be a pre-assessment, an existing work sample, a manager observation, or a defined starting behavior. Choose the baseline that relates to the outcome. A general confidence survey won’t serve as a strong baseline for a technical performance task.
For broader context on connecting analytics with organizational decisions, review Talent Pronto’s data analytics guide. The useful takeaway is to connect measurement to an action, such as revising an activity, adding support, or changing a follow-up intervention.
6. Run a pilot
Use a small pilot group to test the learner experience and the measurement process. Check whether events fire, records join correctly, instructions are clear, rubrics produce stable interpretations, and the assessment reflects the intended skill. Fix the pipeline before the full launch, when changes are cheaper and missing evidence hasn’t accumulated.
UNC’s formal student learning outcomes assessment policy offers a clear mechanics-based model. Describe the outcomes, measure student performance, and use the results to make improvements. That final step should be written into the plan before data collection begins.
When to Stop Measuring and Start Improving
More data can create the appearance of rigor while slowing the work that matters. Teams often collect completion rates, attendance, satisfaction scores, page views, quiz attempts, and open-text comments, then produce a report that changes nothing.
Keep a metric when it helps someone make a defined decision. Drop or de-emphasize it when it merely signals activity without clarifying learning, application, or the next intervention.
Sort metrics by their role
Leading indicators can show whether learners are entering the experience, attempting practice, or receiving support. They help teams intervene early, but they don’t prove the outcome.
Learning evidence shows whether learners can perform the intended action. This includes scored demonstrations, reasoned scenario responses, projects, or other aligned artifacts.
Application evidence shows whether the skill appears beyond the course. Depending on the program, that may come from work samples, observations, support trends, customer-success reviews, or follow-up tasks.
Experience feedback explains friction, clarity, confidence, and perceived relevance. It helps improve design, but it shouldn’t carry the full burden of proving learning.
International comparison makes restraint especially important. PISA began in 2000, repeats every three years, and compares 15-year-olds’ reading, mathematics, and science skills across countries and economies. The assessment has involved more than 100 countries and economies since launch, while the 2022 cycle included 81 countries and economies and released results on 5 December 2023. The OECD’s PISA 2022 results report OECD average mathematics performance of 472 points, reading performance of 476 points, and a 15-point decline in mathematics between 2018 and 2022 across OECD countries.
Those figures demonstrate the value of a stable benchmark, but comparisons still require attention to construct, language, scoring, and context. A measurement loop should end with a decision, revise an activity, improve an assessment, add support, or retire a metric that isn’t helping. If no one can name the action a result will trigger, the program probably needs less reporting and more improvement.
Choose one upcoming course or training program and create its measurement plan before launch. Write the outcomes, map each to direct evidence, define the required data fields, and test the assessment and pipeline with a pilot group. If you need a structured place to explore course design, reporting, and learning operations, browse the practical guides available on LearnStream and turn your next launch into a program you can improve with evidence.