
Tracking Student Progress: The Complete Guide

You probably know the feeling.
You open your course dashboard, see a pile of numbers, and still can’t answer the question that matters most. Are my students moving forward, or are they just clicking around?
That’s where most progress tracking breaks down. Course creators collect data because the platform offers it, not because the data connects to a clear teaching decision or a business decision. So they end up staring at video views, login counts, and quiz exports without knowing what to do next.
I’ve seen this with self-paced courses, cohort programs, membership communities, and internal training portals. The pattern is the same. When tracking student progress is set up well, it helps you improve learning, spot friction early, and make sharper retention decisions. When it’s set up badly, it becomes digital clutter.
The good news is you don’t need a giant data stack to do this well. You need a focused way to define success, collect the right signals, and act on them consistently.
Defining Success Before You Track Anything
If you don’t define success first, tracking student progress turns into hoarding.
A lot of course creators start with whatever their LMS gives them. Completion percentage. Video watch rate. Last login date. Those can be useful, but only after you know what a successful learner should do, know, or produce by the end of your course.
I like to build this from the top down. Start with the overall transformation, then break it into learning objectives, then attach a small set of measurable signals.
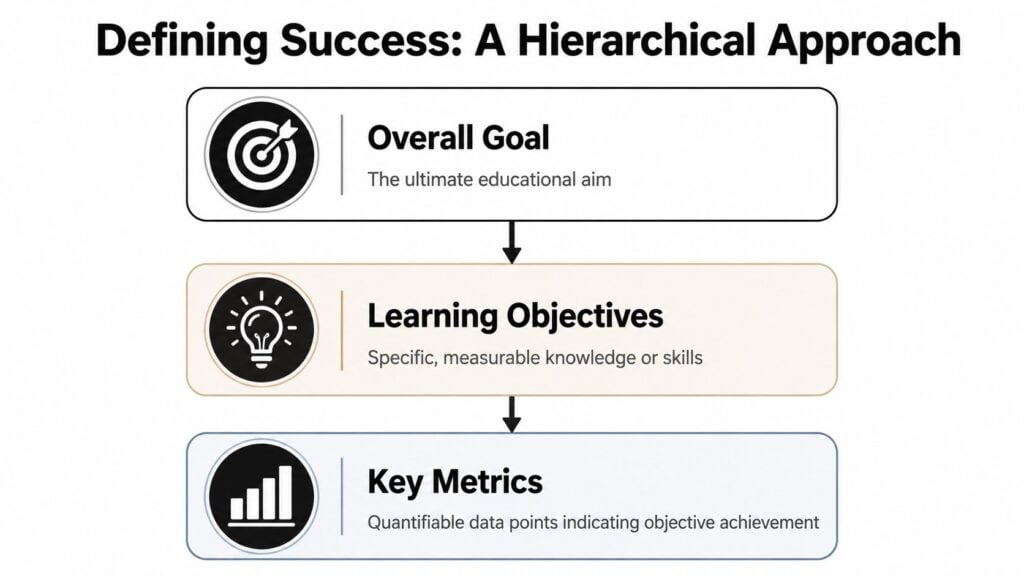
Start with the outcome, not the dashboard
Consider planning a road trip. You don’t begin by obsessing over the fuel gauge. You first decide where you’re going. In a course, that destination might be finishing a portfolio piece, passing a certification exam, launching a first campaign, or mastering a software workflow.
Once that’s clear, define learning objectives that support that result. Good objectives are specific enough that a student can either demonstrate them or not.
For example:
- Engagement objective: Students regularly interact with lessons and key activities.
- Comprehension objective: Students can apply the concept, not just recognize it.
- Completion objective: Students finish the modules that produce the promised outcome.
That hierarchy matters. A 2006 synthesis from the National Center on Student Progress Monitoring found that when teachers used graphed, standardized data to monitor progress, they set more ambitious goals and achieved better outcomes. In math, students in monitored classrooms performed about 1.5 standard deviations higher than peers in control groups over an academic year, according to the National Center on Student Progress Monitoring synthesis.
Practical rule: If a metric doesn’t connect to a decision, don’t track it.
The three KPI buckets I use
Most courses need only a handful of metrics, grouped into three buckets.
| Category | What it answers | Useful examples |
|---|---|---|
| Engagement | Are students showing up and interacting? | lesson opens, video completion, assignment submission timing, forum participation |
| Comprehension | Are they getting it? | quiz attempt success rate, reflection quality, rubric score by criterion, retry patterns |
| Completion | Are they finishing the path that matters? | module completion, time to complete critical modules, milestone completion, final project submission |
The mistake I see most often is choosing too many metrics from the first bucket and not enough from the other two.
A student can watch every video and still learn very little. Another can skip around, move fast, and still achieve the outcome. Raw activity alone doesn’t tell the full story.
Pick KPIs that match your business model too
If you sell a one-off course, your completion metrics might center on finishing a capstone or getting a result quickly.
If you run a membership, retention matters just as much. In that case, look for milestone behaviors that predict ongoing value. For example, did the learner complete the onboarding path, pass the first knowledge check, or attend the first live session?
I also like to pair educational KPIs with commercial ones. That connection is where many creators miss easy wins. A milestone inside the course often tells you more about renewal risk than a billing report does.
If you need a useful companion piece on evaluating outcomes beyond surface metrics, this guide on measuring training effectiveness is worth bookmarking.
And if your audience includes younger learners or families, it also helps to discover how kids set goals because progress tracking works better when the learner understands the target in plain language.
Creating Assessments That Actually Measure Progress
Once you know what success looks like, you need proof that students are getting there.
Many online courses often fall apart. The content may be solid, but the assessments are too fuzzy, too rare, or too easy to game. If all you have is a final completion badge, you won’t know where learners started slipping.
I think about assessments the same way a pilot thinks about instruments. You need quick signals during the flight, not just a report after landing.
Use both quick checks and bigger proof points
Formative assessments are the small checks. These are your polls, one-question quizzes, drag-and-drop exercises, short reflections, and practice prompts. They tell you whether learners are following along in the moment.
Summative assessments are the heavier lifts. These include end-of-module projects, practical demos, scenario-based assignments, presentations, or final exams. They show whether a student can put the pieces together.
A simple mix might look like this:
- After a lesson video: one multiple choice question and one short application prompt
- Mid-module: a mini case study or short quiz with feedback
- End of module: a practical task, worksheet, or submitted artifact
- End of course: a final project tied to real-world promise of the course
What you want to avoid is a course made entirely of passive content and one giant final test. That setup hides confusion for too long.
Build in decision rules before you launch
Assessments become useful when they trigger action.
In curriculum-based measurement, experts recommend pairing data with decision rules, such as changing instruction if a student’s progress slope stays below a benchmark for 4 to 6 weeks. That method helps 60 to 70% of struggling readers catch up, compared with 30 to 40% in groups without it, based on the overview from PBIS Rewards on progress monitoring and CBM.
That principle applies beautifully to digital courses too. You may not be measuring reading fluency, but you can still define rules like these:
- If a learner fails the same quiz twice: assign a review lesson and send a support email
- If a student submits a weak draft: route them to an example library before the next module
- If reflection answers stay vague across lessons: recommend a live Q&A or office hours session
Small assessments work best when they trigger a specific next step.
Keep your rubrics brutally simple
A good rubric saves you time and reduces student anxiety. A messy rubric does the opposite.
For most online courses, I recommend three to five criteria max. That’s enough to create consistency without turning grading into archaeology.
Here’s a clean structure I use often:
| Criterion | Meets expectations | Needs work |
|---|---|---|
| Accuracy | Uses the right concept or method correctly | Contains errors or confusion |
| Application | Applies the concept to the right situation | Stays too theoretical or off-target |
| Clarity | Easy to follow and well organized | Hard to interpret or incomplete |
| Completion | Includes all required elements | Missing required parts |
That table works for written assignments, video submissions, discussion responses, and portfolio tasks.
Low-effort formats that still tell you something useful
Some assessment formats punch above their weight:
- Scenario questions work well because they test decision-making, not memorization.
- Before-and-after self-reviews help students notice growth, especially in skill-based programs.
- Annotated screenshots or screen recordings are excellent for software training.
- Checkpoint templates reduce vague submissions because students respond inside a clear frame.
If I had to choose one rule for assessment design, it would be this. Make the task look as much as possible like the performance you promised in the sales page.
That alignment makes tracking student progress far more honest.
Configuring Your LMS and Analytics for Data Collection
This part is less glamorous, but it’s where the whole system either holds together or falls apart.
Most LMS platforms can track more than creators realize. Teachable, Kajabi, LearnDash, Thinkific, and similar tools usually offer some mix of lesson completion, quiz results, assignment activity, and login history. The problem isn’t a total lack of data. The problem is that the tracking settings are often half-configured.
If your setup is loose, your reports become unreliable fast.
What to turn on inside a typical LMS
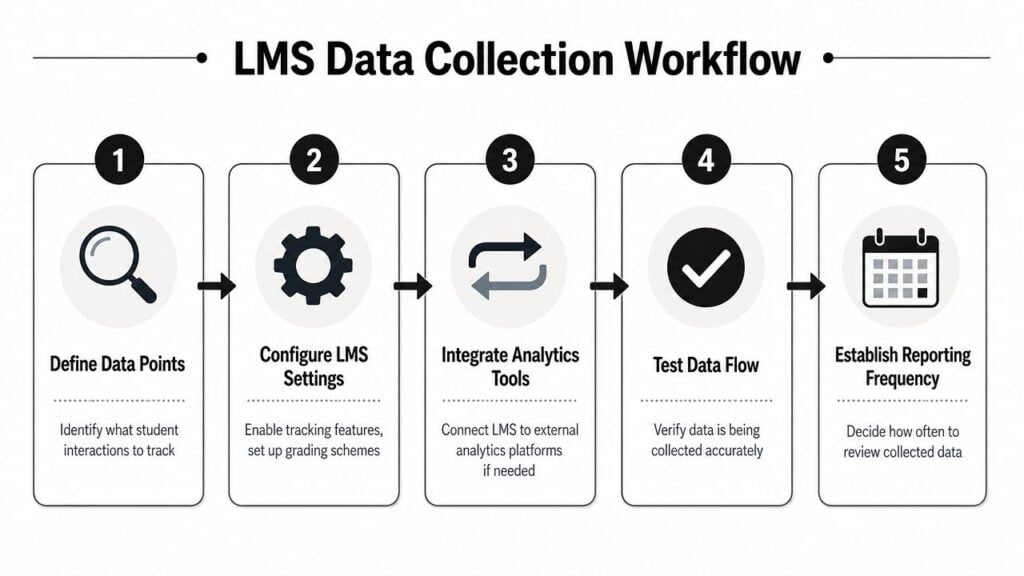
When I audit a course platform, I look for four things first.
- Quiz tracking: Make sure the platform records attempts, scores, and completion status. If possible, store item-level responses so you can see which questions repeatedly cause trouble.
- Lesson completion rules: Don’t rely only on manual checkboxes if your platform supports automatic completion based on viewing, passing, or submitting.
- Assignment submission records: Confirm timestamps are visible. Timing patterns often reveal friction before grades do.
- Video engagement data: If your video host or LMS shows completion percentages, make sure that reporting is enabled and connected to the course record.
On platforms with weaker analytics, you may need light add-ons or external reporting. That’s fine. The key is consistency.
Set thresholds early
Automated learning analytics in higher education and digital courses have been associated with 8 to 15 percentage point improvements in completion and pass rates. Early-warning systems that flag learners with less than 40 to 60% engagement in the first few weeks can reduce dropout rates by 10 to 20%, according to Watermark’s overview of tracking student course and certification progress.
You don’t need a university-sized system to use the same logic.
Set simple thresholds such as:
- Low engagement threshold: limited activity during the opening lessons
- Assessment threshold: repeated misses on a checkpoint quiz
- Submission threshold: no assignment submitted by a milestone date
Those thresholds give your system something to look for.
Test your data before students arrive
Here’s the part people skip.
Run through your course as a fake student. Start a lesson, abandon one halfway, pass a quiz, fail another, submit an assignment late, and see what your reports show. I’ve had platforms mark a lesson complete when the learner only opened the page. I’ve also seen quiz reports fail to separate first attempts from retries.
That’s why I always recommend doing a small internal audit before launch. If you want a practical checklist for that step, this guide on how to audit LMS user activity is a solid reference.
Watch for this: A clean dashboard built on messy tracking settings gives you false confidence.
If your LMS is light on analytics
Some creators are stuck with minimal built-in reporting. In that case, patch the gaps instead of giving up.
A simple setup can include:
- Native LMS tracking for completions and quiz scores
- Google Analytics or event tracking for sales-page-to-course flow and key clicks
- Google Sheets or Airtable for a lightweight intervention log
- Zapier or platform automations to trigger follow-up emails when someone stalls
That stack isn’t fancy, but it’s often enough to support good decisions.
Automation matters because manual exports die quickly. Everyone says they’ll review spreadsheets every Friday. Almost nobody sticks with that for long.
Building Simple and Actionable Dashboards
A useful dashboard should answer a question in seconds.
When I open an instructor dashboard, I want to know where people are getting stuck, who needs help, and whether a part of the course is underperforming. When a student opens their dashboard, they should feel orientation and momentum, not confusion.
Those are two different jobs. So build two different views.
The instructor view
For the instructor, a good dashboard feels like the cockpit of the course.
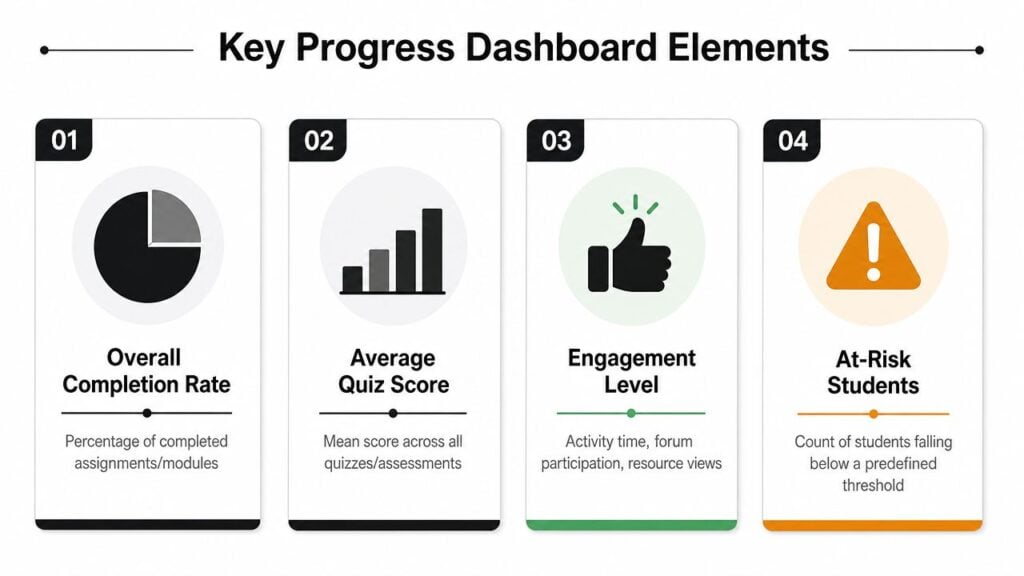
At a glance, it should show:
- Overall completion rate for the course or current cohort
- Average quiz score by module, so weak lessons stand out
- Engagement signals like lesson activity or resource views
- At-risk learners based on your chosen threshold
I like color coding here because it speeds up judgment. Green means healthy progress, yellow means watch closely, red means intervene now. Modern tracking approaches recommend visual displays like green, yellow, and red charts or digital dashboards updated at least weekly because they keep students invested and give instructors a real-time picture of who is on track, according to Teach For America’s guidance on tracking student progress effectively.
The student view
The student dashboard should feel more like a fitness app than an admin panel.
Show progress bars. Mark milestones. Make next steps obvious. A learner shouldn’t have to decode your reporting language to know what to do today.
A clean student-facing view usually includes:
| Student sees | Why it helps |
|---|---|
| Progress through modules | Builds momentum and reduces uncertainty |
| Completed milestones or badges | Reinforces effort and visible progress |
| Upcoming task | Keeps attention on the next action |
| Personal status indicator | Helps the learner self-correct early |
In membership courses, this matters even more. If a learner logs in and can’t tell where they stand, they’re more likely to drift.
Keep the dashboard boring in the best way
I’ve seen creators over-design dashboards with trend charts, tiny widgets, and twelve filters nobody uses.
Don’t do that.
A strong dashboard is plain, readable, and tied to action. If Module 3 quiz performance dips, the dashboard should help you notice. If a student has finished the core path, the dashboard should reflect that success and point toward the next relevant offer or learning step.
If you want a beginner-friendly breakdown of the pieces that matter most, this primer on LMS reporting dashboards lays out the basics well.
A dashboard earns its place when it changes what someone does next.
Using Tracking Data to Boost Engagement and Retention
The payoff happens here.
Good tracking student progress systems don’t stop at reporting. They trigger better teaching moves and sharper business moves. The same data point can help you support a struggling learner today and improve retention next month.
That dual use is one of the most valuable things about digital education.
Turn signals into interventions
Let’s say Module 2 has weak quiz performance and a lot of drop-off before the assignment.
That isn’t one problem. It’s three clues.
First, the concept may not be landing. Second, the assignment may ask for a leap the lesson didn’t prepare students for. Third, the module may be where motivation starts to dip.
That should trigger specific responses:
- Support response: send a review email or offer a shorter recap lesson
- Design response: revise the lesson or split the assignment into smaller steps
- Facilitation response: add a live walkthrough, office hours, or peer discussion prompt
If someone stops logging in, send a check-in message. If they fail the same checkpoint twice, offer an alternate explanation. If they finish a key milestone fast, invite them to the next tier or advanced path.
The action should fit the signal.
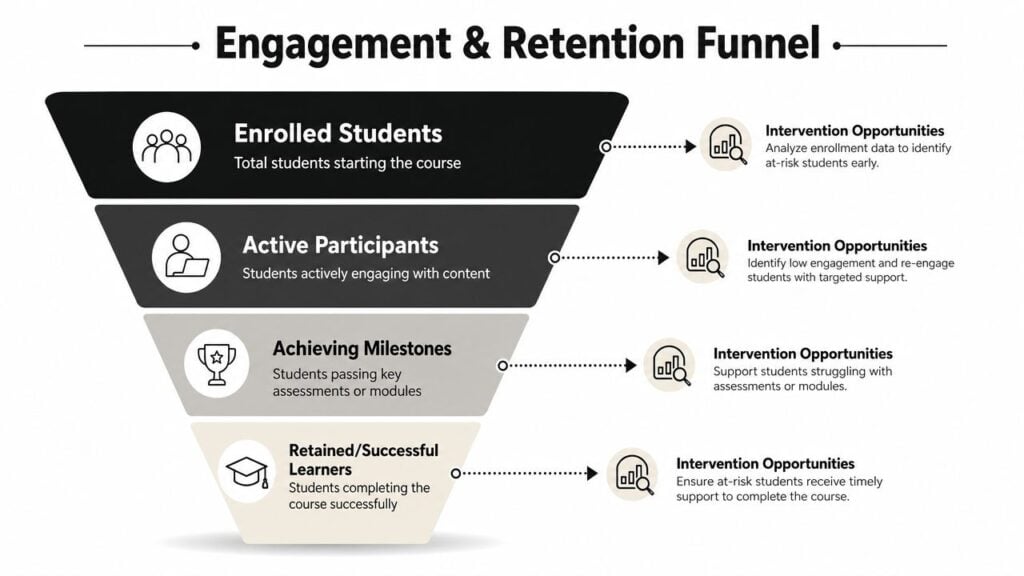
Connect milestone data to retention
Now, course creators can think more like smart operators.
An emerging trend is using progress tracking for monetization. Course creators can analyze metrics like badge attainment or module completion time to identify milestones that correlate with learners being more likely to convert to paid tiers or renew subscriptions, as discussed in Knack’s article on how to track student progress.
That’s a powerful shift in perspective.
If you run a membership, ask questions like these:
- Which early milestone shows that a new member has found value?
- Which completed module tends to come before a renewal?
- Which badge or checkpoint appears before an upsell purchase?
- Where do non-renewing learners usually stall?
You won’t always need perfect attribution. Even a clear directional pattern can improve your decisions.
One data point, two uses
I like using milestone completion as an example because it works on both sides of the business.
Suppose students who complete your “first client win” module stay active longer and are more likely to buy advanced coaching. That tells you two things.
You should get more learners to that milestone faster. And you should treat that moment as a natural place for a next-step offer.
That might mean:
- Simplifying the lead-in lessons
- Adding reminders for stalled students
- Rewriting the module so the win comes sooner
- Triggering a timely invitation to a premium tier after completion
Business lens: The milestone that proves learning value often becomes the milestone that drives retention value.
Don’t automate your way into annoyance
There’s a trade-off here.
Automations are useful, but too many nudges can make your course feel like a needy app. I prefer fewer interventions with clear relevance. A reminder should help the learner recover momentum, not just remind them that your system noticed their absence.
This is also why human review still matters. If one student is disengaged because they’re confused, they need support. If another is disengaged because they already know the material, they may need a shortcut or an advanced path.
The dashboard tells you where to look. Good judgment tells you what to do.
Your Top Questions About Tracking Student Progress
A lot of creators hesitate here for practical reasons, not strategic ones. Fair enough. The setup can feel bigger than it is.
How do I handle privacy without making tracking useless
Tell learners what you track, why you track it, and how it helps them.
Keep that explanation plain. “We track lesson progress, quiz results, and assignment completion so we can spot roadblocks and support you earlier” is better than burying everything in platform jargon.
Also, avoid sharing progress publicly in ways that feel exposing, especially in adult learning environments. If you want learners to compare progress, use private dashboards or learner-controlled views.
How much time does this take each week
Less than commonly feared, if the system is narrow.
The expensive version is tracking everything, reviewing nothing, and manually exporting reports. The manageable version is choosing a few core metrics, automating collection, and reviewing them on a fixed rhythm.
I usually recommend a simple cadence:
- Weekly: check at-risk learners, stalled modules, and weak assessments
- Monthly: review trend patterns and content friction points
- Quarterly or per cohort: revise thresholds, automations, and milestone design
That’s sustainable for most creators.
What if my platform barely has analytics
You can still build a functional system.
Use the LMS for whatever it does track. Then layer in lightweight tools like quiz forms, spreadsheets, or tagged email automations. Even a basic Google Form for assignment checkpoints can give you a better progress record than no record at all.
If you teach language learners or mixed-skill groups, practical examples from classrooms can help here too. I’ve found this roundup of teacher tools for ESL tracking useful because it shows how educators simplify tracking when contexts are messy.
What should I track first if I’m starting from zero
Start with one metric from each of these areas:
- Engagement: lesson or module activity
- Comprehension: quiz or checkpoint performance
- Completion: milestone or final deliverable completion
That trio gives you enough to spot common issues without drowning in data.
If you can answer these three questions each week, you’re in good shape:
- Who’s falling behind?
- Where are they getting stuck?
- What will I change because of that?
That’s the heart of tracking student progress.